
Love Vtrender Charts? Check out our new offer!
Control in the options market does not always show up as a clean candle. Sometimes it shows up as a range that refuses to break. Sometimes it appears as repeated pressure near the same strike. Sometimes it appears as a sudden swipe that changes the tone of the session.
NTM VolX is designed for this question: who is controlling the near-the-money area right now?
This post is the blog companion to the NTM VolX pillar page. Read the pillar for the complete tool framework, and use this note as the shorter control-read explanation.
Terms used in this note: NTM VolX, VXR, Buyer Control, Seller Control, Value Area.
Near-the-money matters because these are the strikes closest to spot. They are mechanically important. Hedging, writing, covering and short-term pressure often concentrate around these strikes during the trading session.
The VXR range helps convert that activity into a readable pressure scale. When VXR is quiet, control may be balanced. When VXR expands, near-the-money pressure is becoming more active. When VXR becomes one-sided, the trader should ask whether buyers or sellers are beginning to control the range.
NTM Volx displays three elements:
Call volume (blue line),
Put volume (purple line),
and their ratio (VXR).
The blue line shows Call buyer aggression. The purple line shows Put buyer aggression. Price is the outcome. The lines show who produced that outcome.
Balance State
Both lines run parallel, close together, crossing frequently. VXR hovers near 1.0.
Neither side dominates. The market oscillates in a range. Premium decays. No directional edge exists.
Imbalance State
One line makes a sharp angular move—45 degrees or steeper. The other stays flat. The distance between them widens. VXR moves toward 2.0, then 3.0.
One side has overpowered the other. Directional movement follows.
VXR Range | Market Condition |
|---|---|
~1.0 | Balance. No dominant side. |
1.5–2.0 | Imbalance building. One side gaining control. |
2.5–3.5 | Clear imbalance. Trend established. |
4.0+ | Extended. Reversion risk increases. |
The Blue Line vs. The Purple Line: The Real Battle
NTM Volx has three components, but two of them tell you everything you need to know:
Blue Line = Call Volume (Demand/Buyers)
When this line is rising steeply, it means Call buyers are aggressive. They're willing to pay up. They have conviction. They're in control.
Purple Line = Put Volume (Supply/Sellers)
When this line is rising steeply, it means Put buyers are aggressive. They're betting on downside. They have conviction. They're in control.
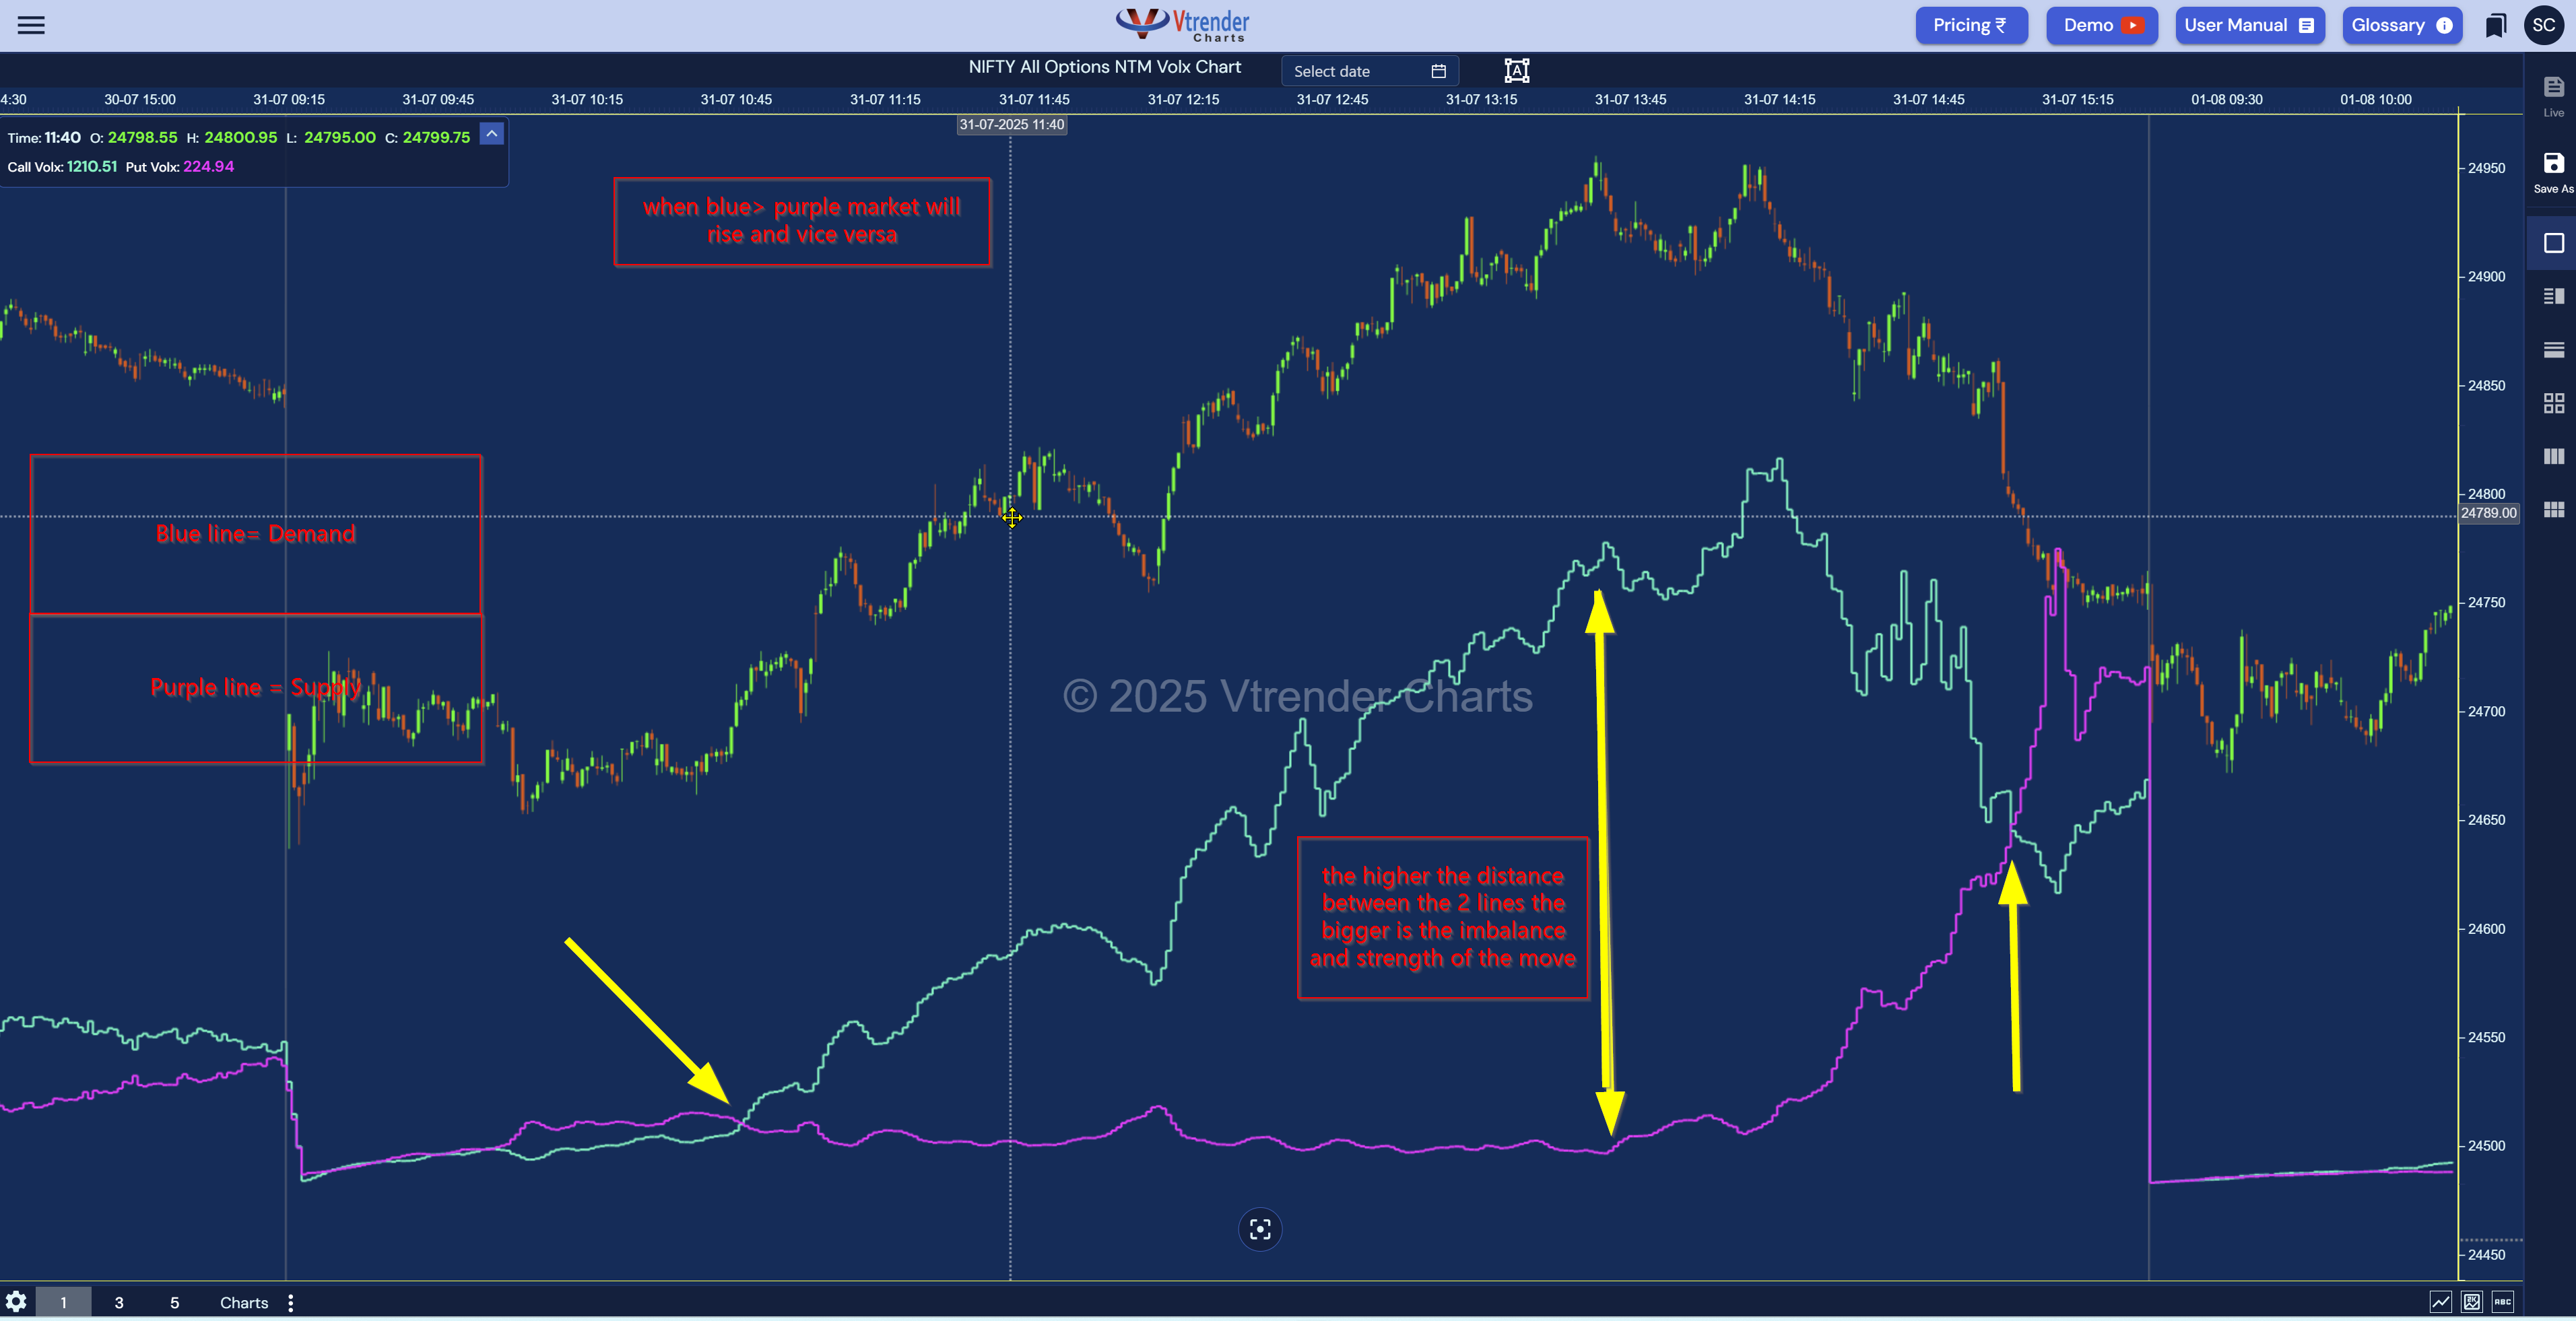
Here's a real example from two weeks ago that made this crystal clear.
Tuesday, 9:45 AM - Nifty at 21,580:
Price chart showed: Slight uptrend, nothing special.
NTM Volx showed: Blue line swiping up sharply at a 60-degree angle. Purple line flat, barely moving.
Translation: Call buyers are dominating. Puts aren't even showing up to fight. Buyers have complete control.
What happened next? Nifty went from 21,580 to 21,665 in 35 minutes. Straight up, barely a pullback.
Could you see that coming from the price chart? Maybe. But NTM Volx showed you the underlying force before the price move became obvious.
Balance vs. Imbalance: The Only Two States That Matter
The market is always in one of two states. Understanding which one you're in determines whether you should trade or wait.
Balance State - "Snakes Hugging"
This is what I call the "snakes hugging each other" pattern. The blue and purple lines run parallel, close together, crossing over multiple times.
What it means: Neither side has control. Buyers push, sellers push back. Nobody's winning. The market is choppy.
What you do: Stay out. Option premiums are decaying. You're bleeding money just holding positions. No edge here.
Imbalance State - "The Swipe and Divergence"
This is what you're waiting for. One line (blue or purple) makes a sharp angular move - what I call "the swipe." Usually 45 degrees or steeper. Then the distance between the two lines keeps widening - that's the divergence.
What it means: One side has taken control. They're overpowering the other side. A directional move is happening.
What you do: This is your trading opportunity. Align with whoever's in control.
Last Thursday was a perfect example. Nifty opened at 21,520 and the lines were hugging - balance state. I stayed flat.
At 10:20 AM, the purple line swiped up sharply while the blue line stayed flat. Imbalance. Sellers in control. I immediately looked for Put opportunities.
Nifty dropped from 21,520 to 21,450 over the next hour. Clean 70-point move. Because I waited for imbalance instead of forcing trades during balance, I caught the actual move with clear edge.
Understanding [how imbalances create directional moves](https://vtrender.com/posts/seeing-the-market-in-layers-the-power-of-multi-window-visualization) transforms your entire approach to trading.
Want to see how we identify these balance and imbalance states in live markets? Watch this:
: https://youtu.be/YOUR_NTM_VOLX_VIDEO_HERE]
The VXR Ratio: Measuring the Strength
Okay, so you can see when imbalance starts (the swipe), and you can see it continuing (the divergence). But how strong is it? How much conviction is behind this move?
That's where the VXR ratio comes in. It's a simple number that quantifies the imbalance.
VXR around 1.0 - The Standoff
Buyers and sellers evenly matched. This is balance. Stay patient.
Last Monday morning, VXR hovered between 0.95 and 1.05 for 90 minutes. Nifty oscillated in a 30-point range. Nothing tradeable. Just noise.
VXR rising toward 2.0 - The Ignition
One side is starting to overpower the other. The imbalance is building. Pay attention.
That same Monday at 11:00 AM, VXR pushed to 1.8. The purple line was starting to swipe. I got ready but didn't trade yet.
VXR rising toward 3.0 - The Takeover
Clear, strong imbalance. One side is in complete control. The trend is established.
By 11:15 AM, VXR hit 2.9. Purple line diverging strongly from blue. This was my signal. I went short. Nifty dropped 55 points over the next 40 minutes.
VXR at 4.0+ - The Warning Zone
The move is getting stretched. Like a rubber band pulled too far, it might snap back. Time to be defensive.
When VXR hit 4.2 at 12:00 PM, I took profits on half my position. Good thing, because Nifty bounced 25 points in the next 15 minutes as some profit-taking kicked in.
The VXR ratio gives you a roadmap:
- 1.0 = Wait
- 2.0 = Get ready
- 3.0 = Trade with conviction
- 4.0+ = Protect profits
Real Trade Walkthrough: Wednesday's Perfect Setup
Let me show you exactly how I use NTM Volx in a real trade, from start to finish.
9:20 AM - Market Opens
Nifty opens at 21,490. I pull up NTM Volx.
Blue and purple lines are hugging each other. VXR is at 1.02. Balance state. I stay flat, waiting.
9:45 AM - First Swipe Attempt
Blue line tries to swipe up. Gets to about 30-degree angle, VXR pushes to 1.6.
But then... purple line catches up. The angle flattens. VXR falls back to 1.3. False start. The bulls tried to take control but couldn't maintain it.
I don't trade this. Waiting for clear, sustained imbalance.
10:15 AM - The Real Swipe
Purple line makes a sharp 55-degree swipe upward. Blue line stays completely flat. This is different from the 9:45 AM attempt. This has conviction.
VXR jumps from 1.3 to 2.2 in five minutes.
10:20 AM - Divergence Confirmed
Purple line keeps climbing. Blue line still flat. The distance between them is widening rapidly. VXR hits 2.8.
This is my entry signal. Sellers have control. Clear imbalance. I buy Puts at 21,485.
10:45 AM - Watching the Ride
VXR hits 3.4. Purple line still diverging. Nifty at 21,440. I'm up 45 points.
I hold. The imbalance is strong and confirmed.
11:20 AM - Exit Signal
VXR hits 4.1. This is my warning zone. The move might be getting stretched.
I take profits at 21,420. Banked 65 points.
11:30 AM - Validation
Nifty bounces to 21,445 as some buyers step in. VXR falls back to 3.2. The rubber band snapped back a bit, just as expected at 4.0+.
This is NTM Volx trading in practice. Wait for balance to break. Enter when imbalance is confirmed. Exit when it gets stretched. Simple framework, powerful results.
Common Mistakes I See (and Made Myself)
Mistake 1: Trading During Balance
The lines are hugging, VXR is near 1.0, and you force a trade anyway because "you need to be active."
Don't. You're just donating premium to theta decay. Wait for imbalance.
Mistake 2: Ignoring the Swipe Angle
A 15-degree drift of the blue line isn't a swipe. You need sharp, decisive angles - 45 degrees or more. Weak angles lead to false signals.
Mistake 3: Not Respecting VXR 4.0+
When VXR hits 4.0 or higher, the move is stretched. This isn't a signal to enter new trades in that direction. It's a signal to protect profits or stay out.
I made this mistake two weeks ago. VXR was at 4.5, purple line way above blue. I thought "the trend is so strong, let me add to my shorts."
Nifty immediately bounced 40 points. I learned: 4.0+ means caution, not aggression.
Mistake 4: Watching VXR Without Watching the Lines
The ratio alone isn't enough. You need to see the visual swipe and divergence on the actual chart. The VXR confirms what the lines are showing you, but the lines tell the story.
## From Reactive to Proactive
Here's what changed for me after I started using NTM Volx consistently:
Before NTM Volx:
- Watched price candles
- Chased moves after they were obvious
- Entered late, exited poorly
- No idea who was actually in control
- Confused by choppy markets
After NTM Volx:
- Watch Call vs. Put volume battle
- See control shift before price makes big moves
- Enter early when imbalance confirms
- Know exactly who has control and how strong it is
- Avoid choppy balance periods completely
The difference isn't subtle. It's the difference between guessing and knowing. Between reacting and anticipating.
You stop asking "what is price doing?" and start asking "who is in control?"
That one shift changes everything.
Ready to start seeing who's actually in control? Our [NTM Volx charts](https://vtrender.com/charts) track Call vs. Put volume battles in real-time for Nifty and Bank Nifty, showing you exactly when balance breaks and imbalance takes over.
Want to master NTM Volx systematically alongside Order Flow, Market Profile, and complete market structure analysis? Our [comprehensive E-Course](https://vtrender.com/e-course) teaches you how to integrate all these tools to read institutional control - the same multi-layered approach professionals use.
Or join us at the [Vtrender Live Desk](https://vtrender.com/live-desk) where we call out VXR ratio shifts, swipe formations, and imbalance confirmations in real-time every session, helping you catch these control shifts as they happen.
Stop watching price. Start watching control.
NTM VolX is not about predicting every tick. It is about seeing whether near-the-money pressure is controlling the session.
Read next: NTM VolX Guide and A Beginner's Guide to Market Profile.
For the full sequence, read the Vtrender Learning Pathway. To watch NTM VolX live, open Vtrender Charts.

Markets don't move because indicators change.
Indicators change because markets move.
A practical reference for NSE & BSE derivatives traders. 366 pages, built to sit open beside live charts.