
Love Vtrender Charts? Check out our new offer!
NTM VolX is Vtrender's near-the-money options pressure tool. It focuses on the strikes closest to the current price, where options activity can influence intraday range, pressure and control.
This post is the blog companion to the NTM VolX pillar page. Read the pillar when you want the full framework, and use this note as the practical trading example.
Terms used in this note: NTM VolX, VXR, Volume Swipes, Buyer Control, Seller Control.
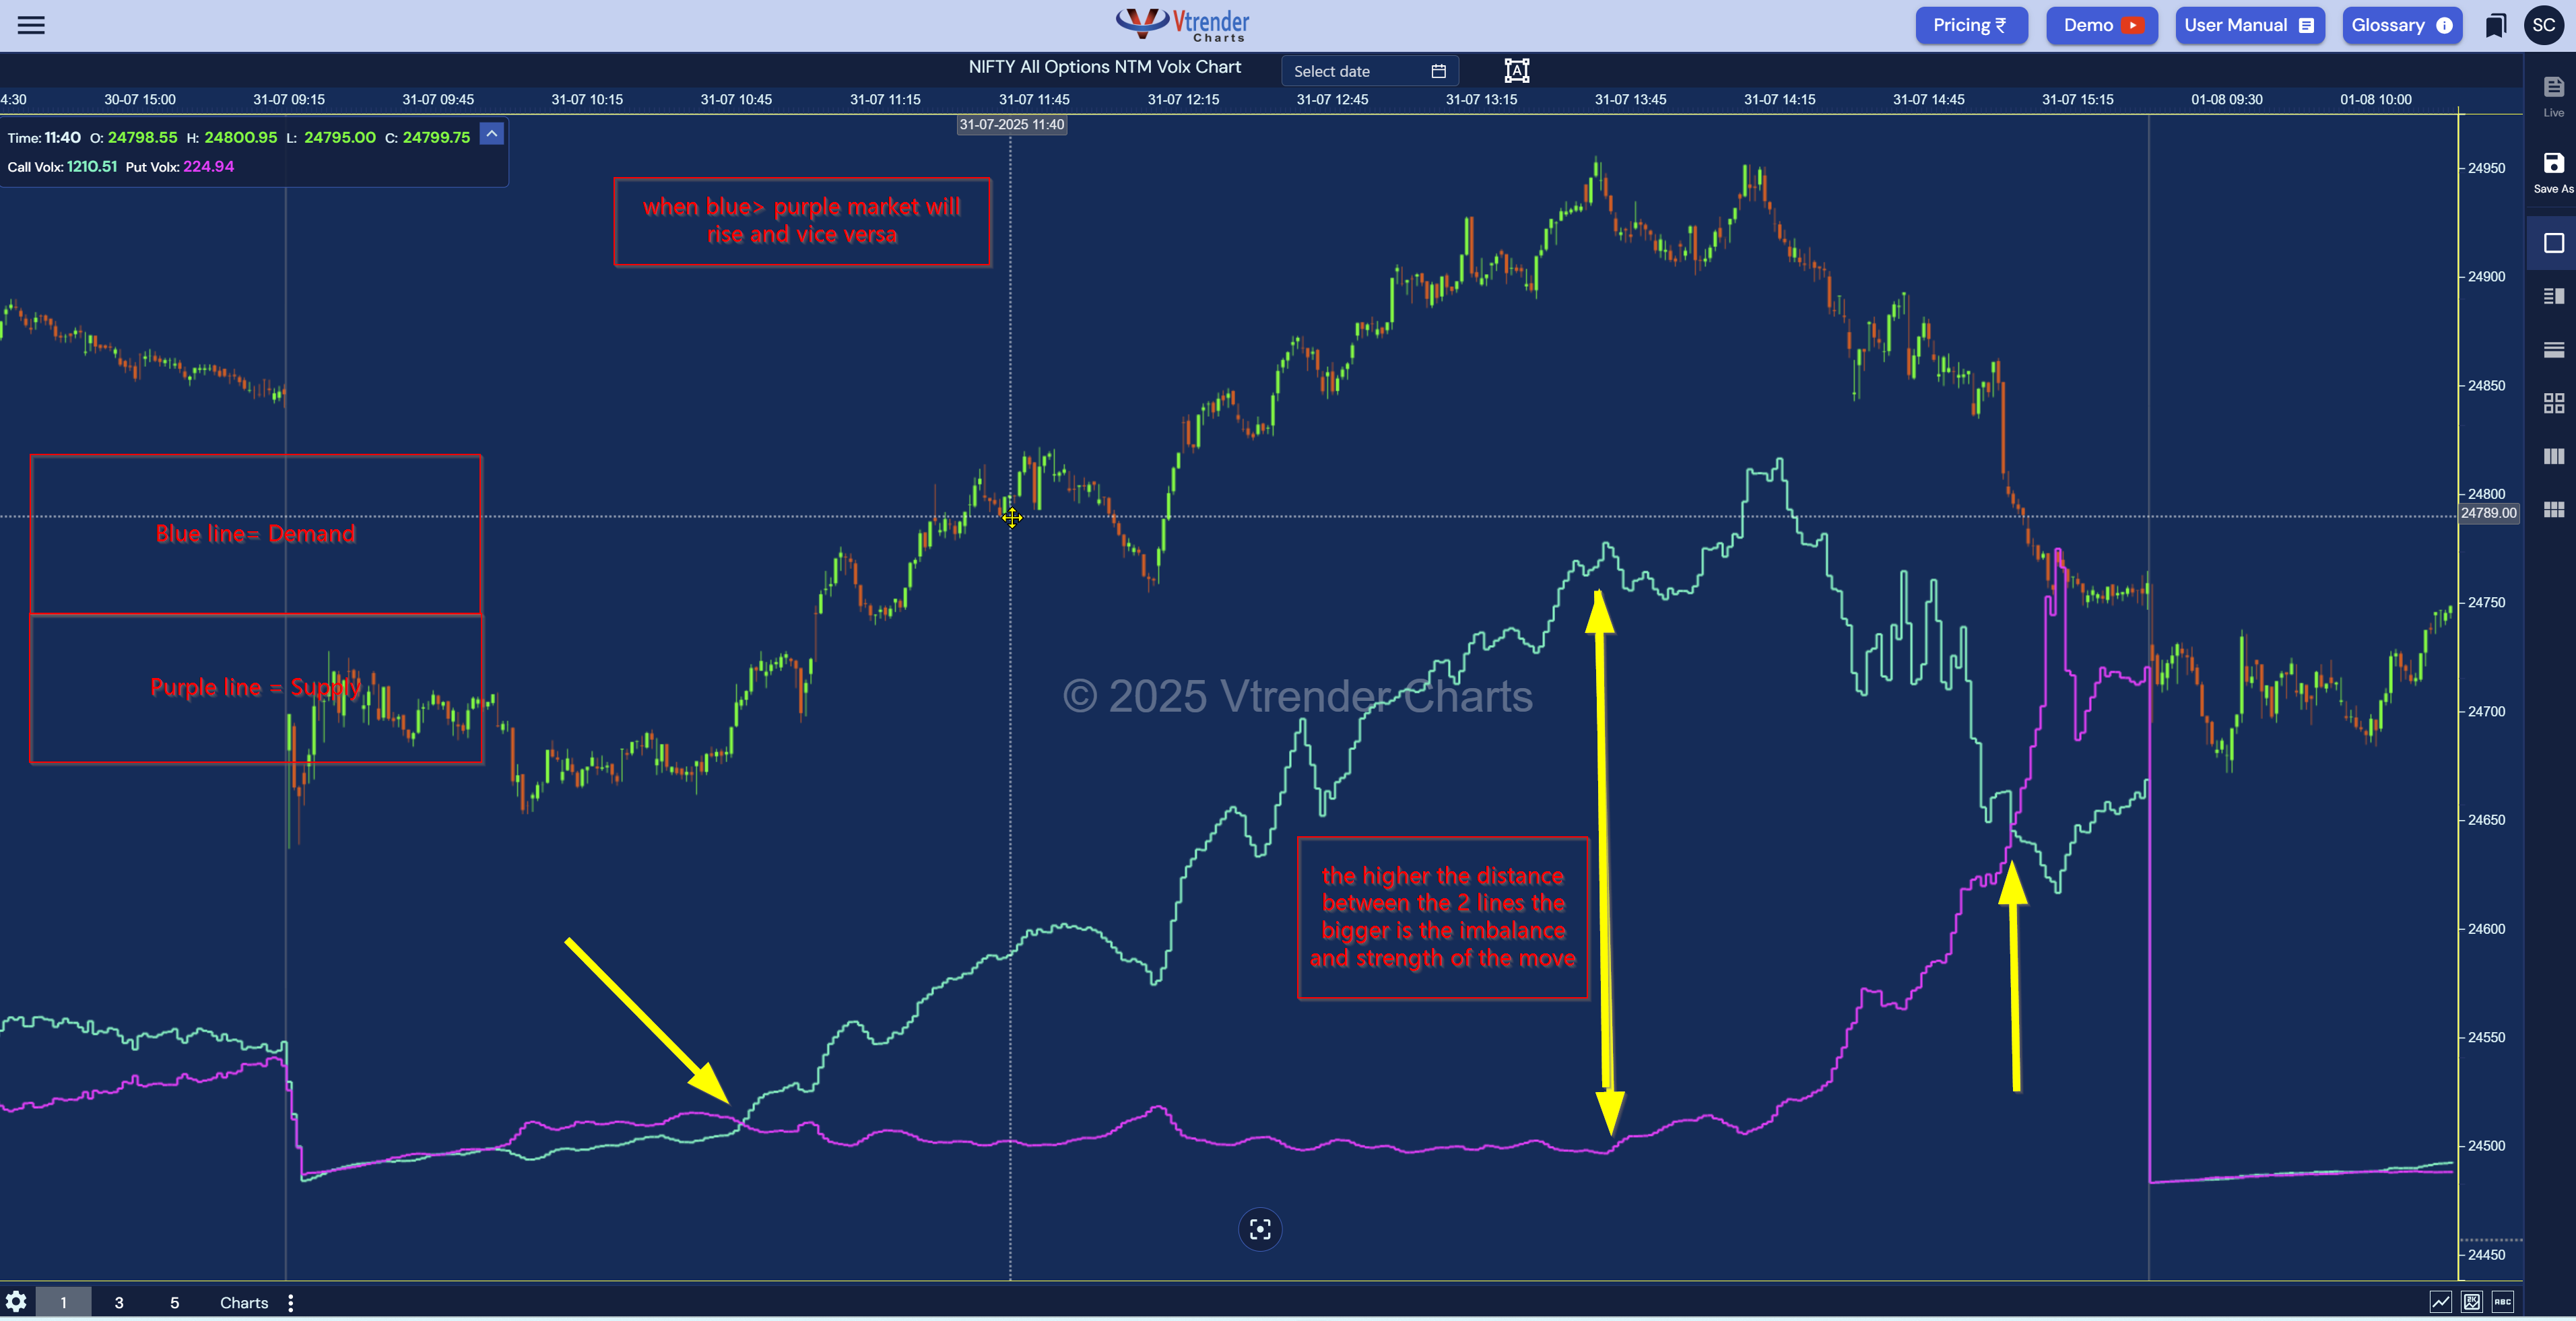
NTM Volx displays three elements: Call volume (blue line), Put volume (purple line), and their ratio (VXR).
The blue line shows Call buyer aggression. The purple line shows Put buyer aggression. Price is the outcome. The lines show who produced that outcome.
Balance State
Both lines run parallel, close together, crossing frequently. VXR hovers near 1.0.
Neither side dominates. The market oscillates in a range. Premium decays. No directional edge exists.
Imbalance State
One line makes a sharp angular move—45 degrees or steeper. The other stays flat. The distance between them widens. VXR moves toward 2.0, then 3.0.
One side has overpowered the other. Directional movement follows.
VXR Range | Market Condition |
|---|---|
~1.0 | Balance. No dominant side. |
1.5–2.0 | Imbalance building. One side gaining control. |
2.5–3.5 | Clear imbalance. Trend established. |
4.0+ | Extended. Reversion risk increases. |
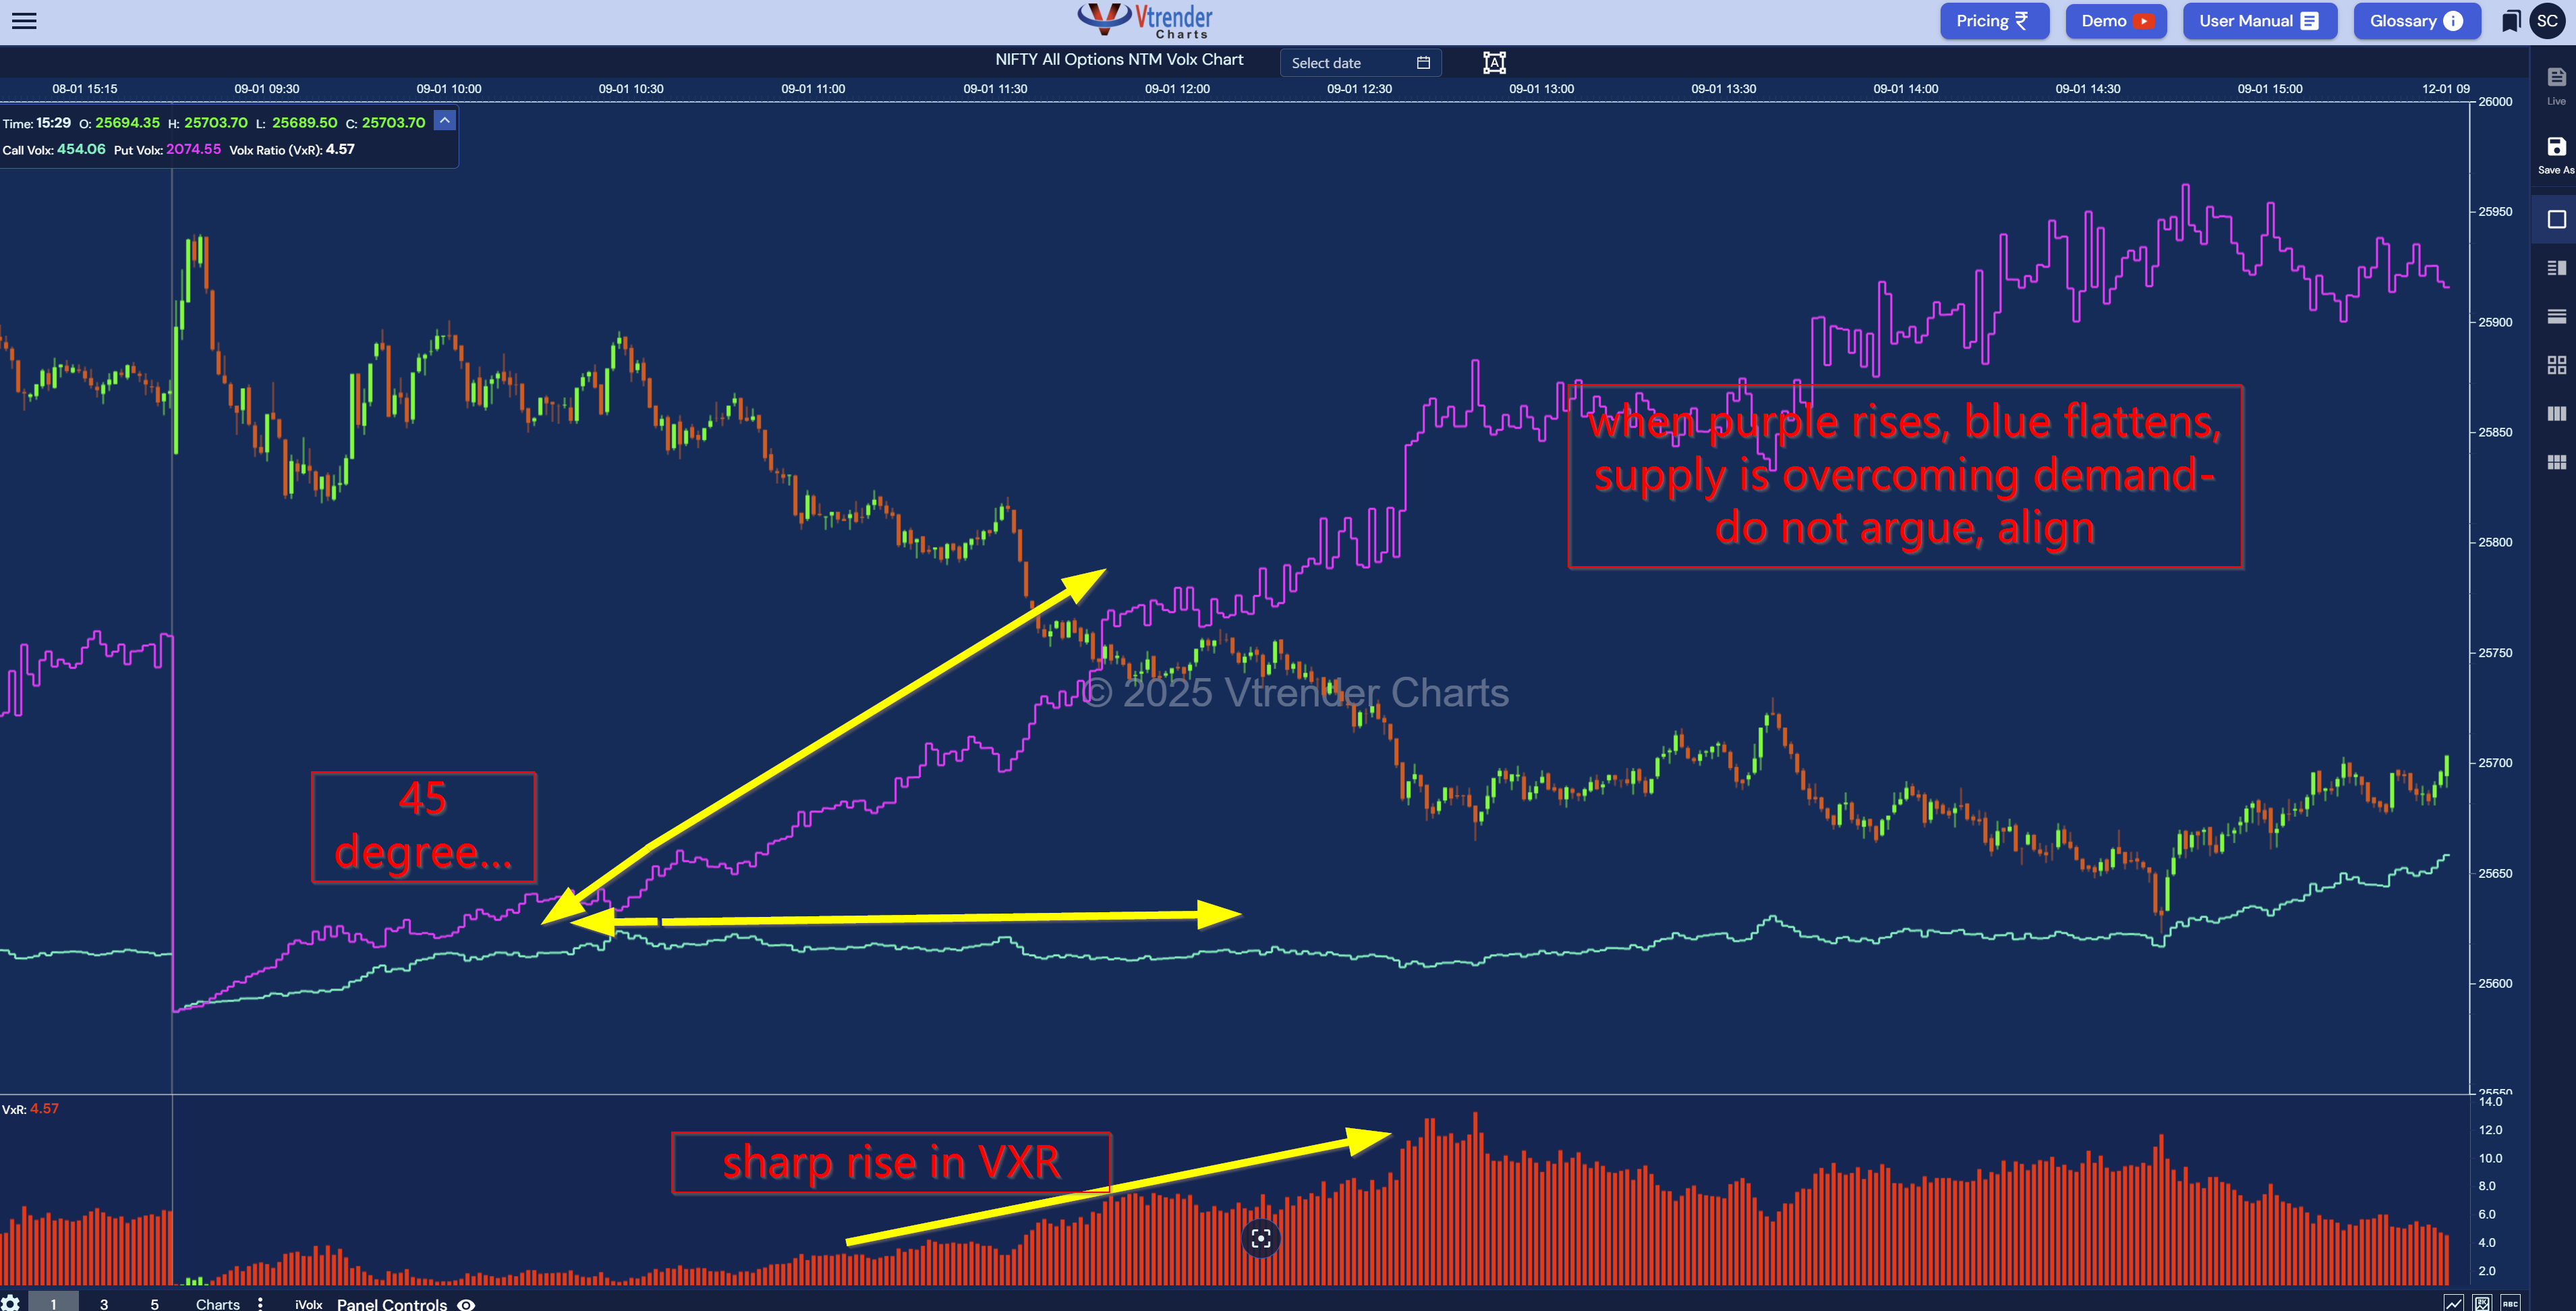
9:20 AM — Nifty at 25,950. Lines hugging. VXR at 1.02. Balance.
10:05 AM — Purple line rises sharply. Reached 45-degree angle. This is an optimal setup for shorts
10:55 AM — Purple line continues up at 45 degrees. Blue stayed flat. VXR jumped to 5
12:50 PM — Divergence confirmed. VXR at 11.0. Sellers in absolute control.
14:45 PM — VXR at 10.4. Nifty at 25,440. Down 400 points from signal.
15:20 PM — Purple drops a bit, supply being booked
Trading during balance. Lines hugging, VXR near 1.0. No edge. Premium bleeds.
Weak angles. A 15-degree drift isn't a swipe. Sharp, decisive angles—45 degrees or more—mark real control shifts.
Ignoring extension. VXR above 4.0 signals stretch, not strength. New positions carry reversion risk.
VXR without context. The ratio confirms. The lines tell the story. Both matter.
Price shows what happened. NTM Volx shows who made it happen.
Balance means wait. Imbalance means one side has control. VXR measures how much.
Most traders look at the full options chain and get lost in too many strikes. NTM VolX narrows the question. It asks: near the current market price, are call-side participants in control, put-side participants in control, or is the range balanced?
The key read is the VXR range. A low VXR reading suggests the market is not strongly one-sided. A rising VXR reading suggests that near-the-money pressure is becoming more directional. When the VXR reading becomes extreme, the trader should stop treating the market as normal noise.
The useful question is not just "is NTM VolX high?" The better question is: where is the market when NTM VolX rises?
This is where Market Profile matters. If NTM VolX rises near a Value Area edge, Initial Balance break, or a rejected price zone, the read becomes more meaningful. Options pressure at random location is information. Options pressure at structure is context.
The next link is Spectrum. Spectrum shows CE walls, PE walls and writer defence on the price axis. If NTM VolX shows pressure and Spectrum shows a wall shifting or collapsing, the trader has a cleaner read of range control.
The Options Table adds strike-level evidence: OI, change in OI, volume, VWAP and DPOC. If NTM VolX says near-the-money pressure is active, the Options Table helps show which strikes are participating.
Finally, Gamma tells whether the options structure is likely to pin, compress or accelerate price. NTM VolX can show pressure. Gamma helps explain whether that pressure has room to travel.
A practical NTM VolX workflow:
Start with Market Profile to locate the auction.
Check NTM VolX for near-the-money pressure.
Use Spectrum to see whether writers are defending or shifting.
Confirm the strike-level story in the Options Table.
Use Gamma to judge whether the market is more likely to pin or expand.
Tools
NTM Volx Charts — Real-time Call vs. Put volume tracking for Nifty and Bank Nifty.
Learning
E-Course — NTM Volx alongside Order Flow, Market Profile, and market structure analysis.
ead next: Understanding NTM VolX and Decoding the Spectrum Chart.
Start the full tool sequence here: Vtrender Learning Pathway. To watch NTM VolX live, open Vtrender Charts.

Markets don't move because indicators change.
Indicators change because markets move.
A practical reference for NSE & BSE derivatives traders. 366 pages, built to sit open beside live charts.