
Love Vtrender Charts? Check out our new offer!
Price can move for two very different reasons. It can move because new participants are entering with conviction. Or it can move because old participants are exiting under pressure.
MFLOW is built to separate those two conditions.
This post is the blog companion to the MFLOW pillar page. Read the pillar when you want the full framework, and use this note to understand new business versus old business in real time.
Terms used in this note: New Business, Old Business, Long Liquidation, Short Covering, Unwind.
You know that sinking feeling when you buy calls during what looks like a strong rally, only to watch the market reverse 10 minutes later?
The volume chart looked perfect. The price action looked perfect. What went wrong?
Here's what you didn't see: while price was rising, the MFlow 2.0 panel was showing hollow red bars. Not solid green. Hollow red. Translation: Old longs were exiting. They were taking profits into the rally. New money wasn't buying. Old money was selling.
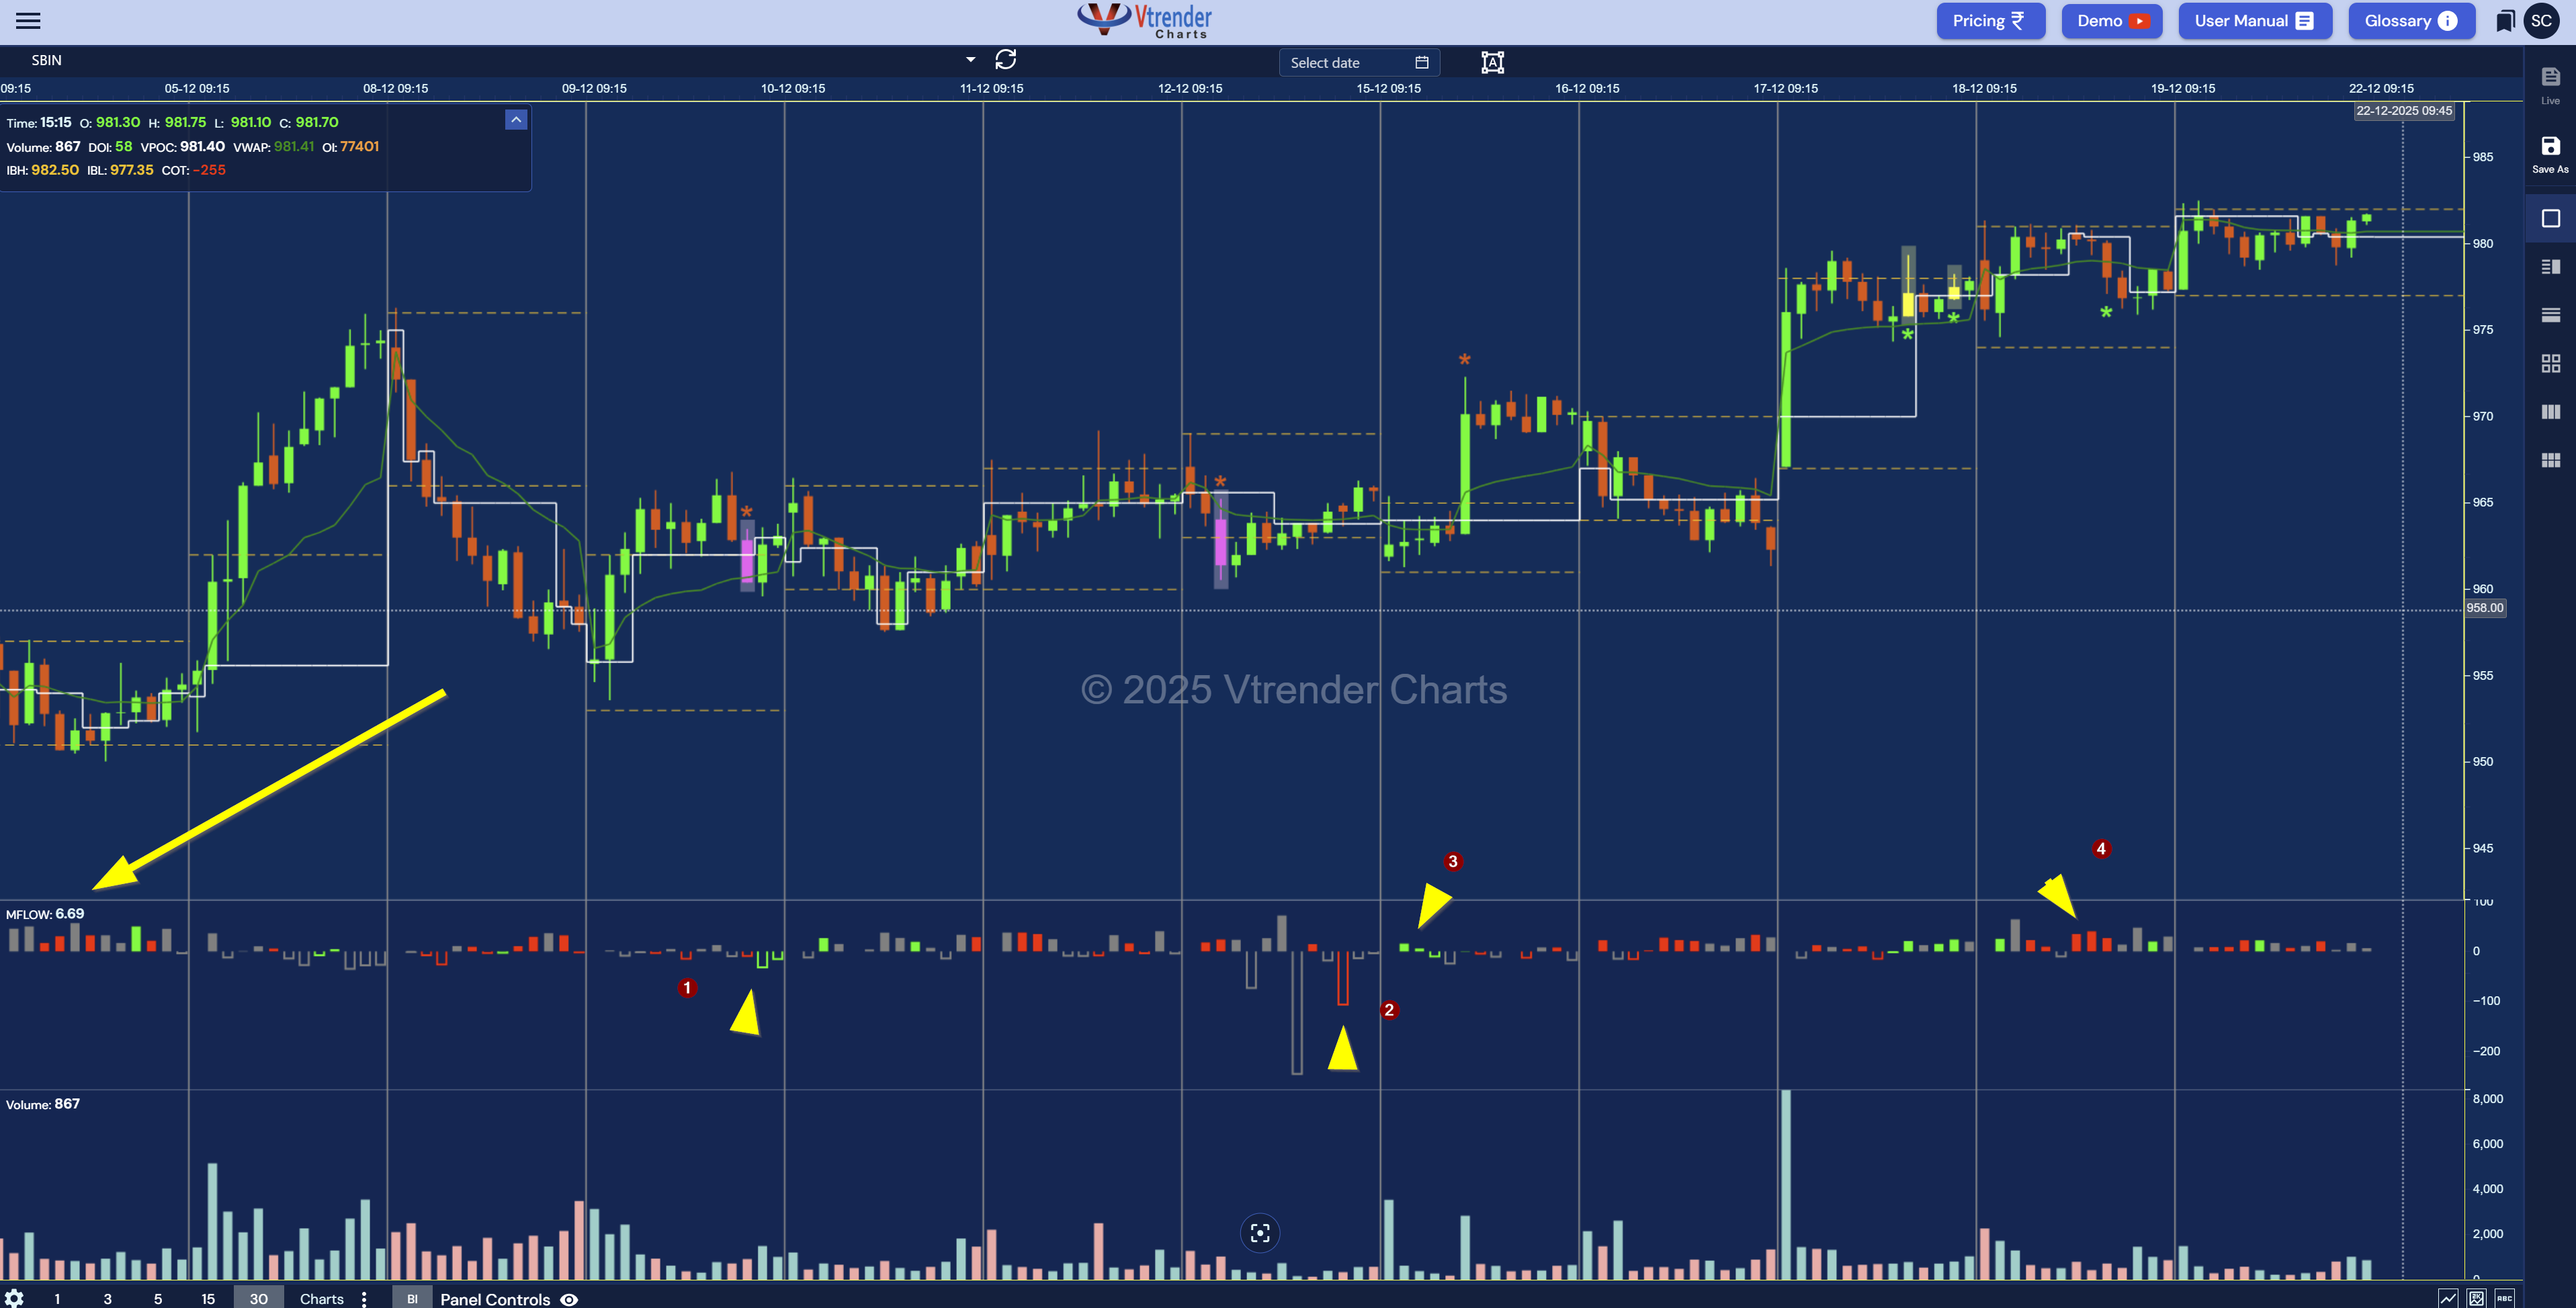
You were buying calls from smart money who was liquidating positions into strength. You were the exit liquidity.
This is why understanding [New Business vs. Old Business](https://vtrender.com/pillar/mflow) changes everything. It's not enough to see volume. You need to see who's behind that volume and what they're doing.
Most traders see volume as a single number.
MFlow 2.0 breaks it apart into who is entering, who is exiting, and who is being forced to move.
Built on Vtrender’s tick data feed and a proprietary classification algorithm, MFlow 2.0 separates every traded lot into new business vs old business, and then goes one step deeper:
Are they opening longs or shorts?
Are they covering shorts or liquidating longs?
Is this meaningful flow or just background noise?
On the chart, that story is told through a simple but powerful color code.
Every bar in the MFlow 2.0 panel answers two questions:
Is this New Money or Old Money?
And are they Long or Short?
We express that visually:
Fresh buyers are stepping in and opening long positions.
Meaning: New money, bullish intent.
Typical context:
Calls being bought.
Futures/stock longs initiated at new levels.
Implication: If price is rising with strong solid-green MFlow, the move has real fuel behind it.
New shorts are being opened with conviction.
Meaning: New money, bearish intent.
Typical context:
Calls being written at higher strikes.
Futures/stock shorts initiated after a failed rally.
Implication: If price is falling with strong solid-red MFlow, sellers are in control and building positions, not just booking profits.
Existing shorts are being closed; shorts are buying back.
Meaning: Old business, money exiting short positions.
Typical context:
Short writers forced to cover as price runs against them.
End-of-day or end-of-series short covering.
Implication: A down move that suddenly sees strong hollow green can be a “short-covering rally”, not the start of a fresh uptrend.
Old longs are throwing in the towel and exiting.
Meaning: Old business, money exiting long positions.
Typical context:
Profit-taking after a strong uptrend.
Longs bailing out after a breakdown.
Implication: An up move that shifts into hollow red is losing its internal demand; the move can stall, fade, or reverse.
Grey prints are the background hum of the market.
Meaning: Low-quality, low-signal flow that doesn’t pass our thresholds for clear classification.
Implication: Useful as context, but not where decisions should be anchored. You trade off greens and reds, not greys.
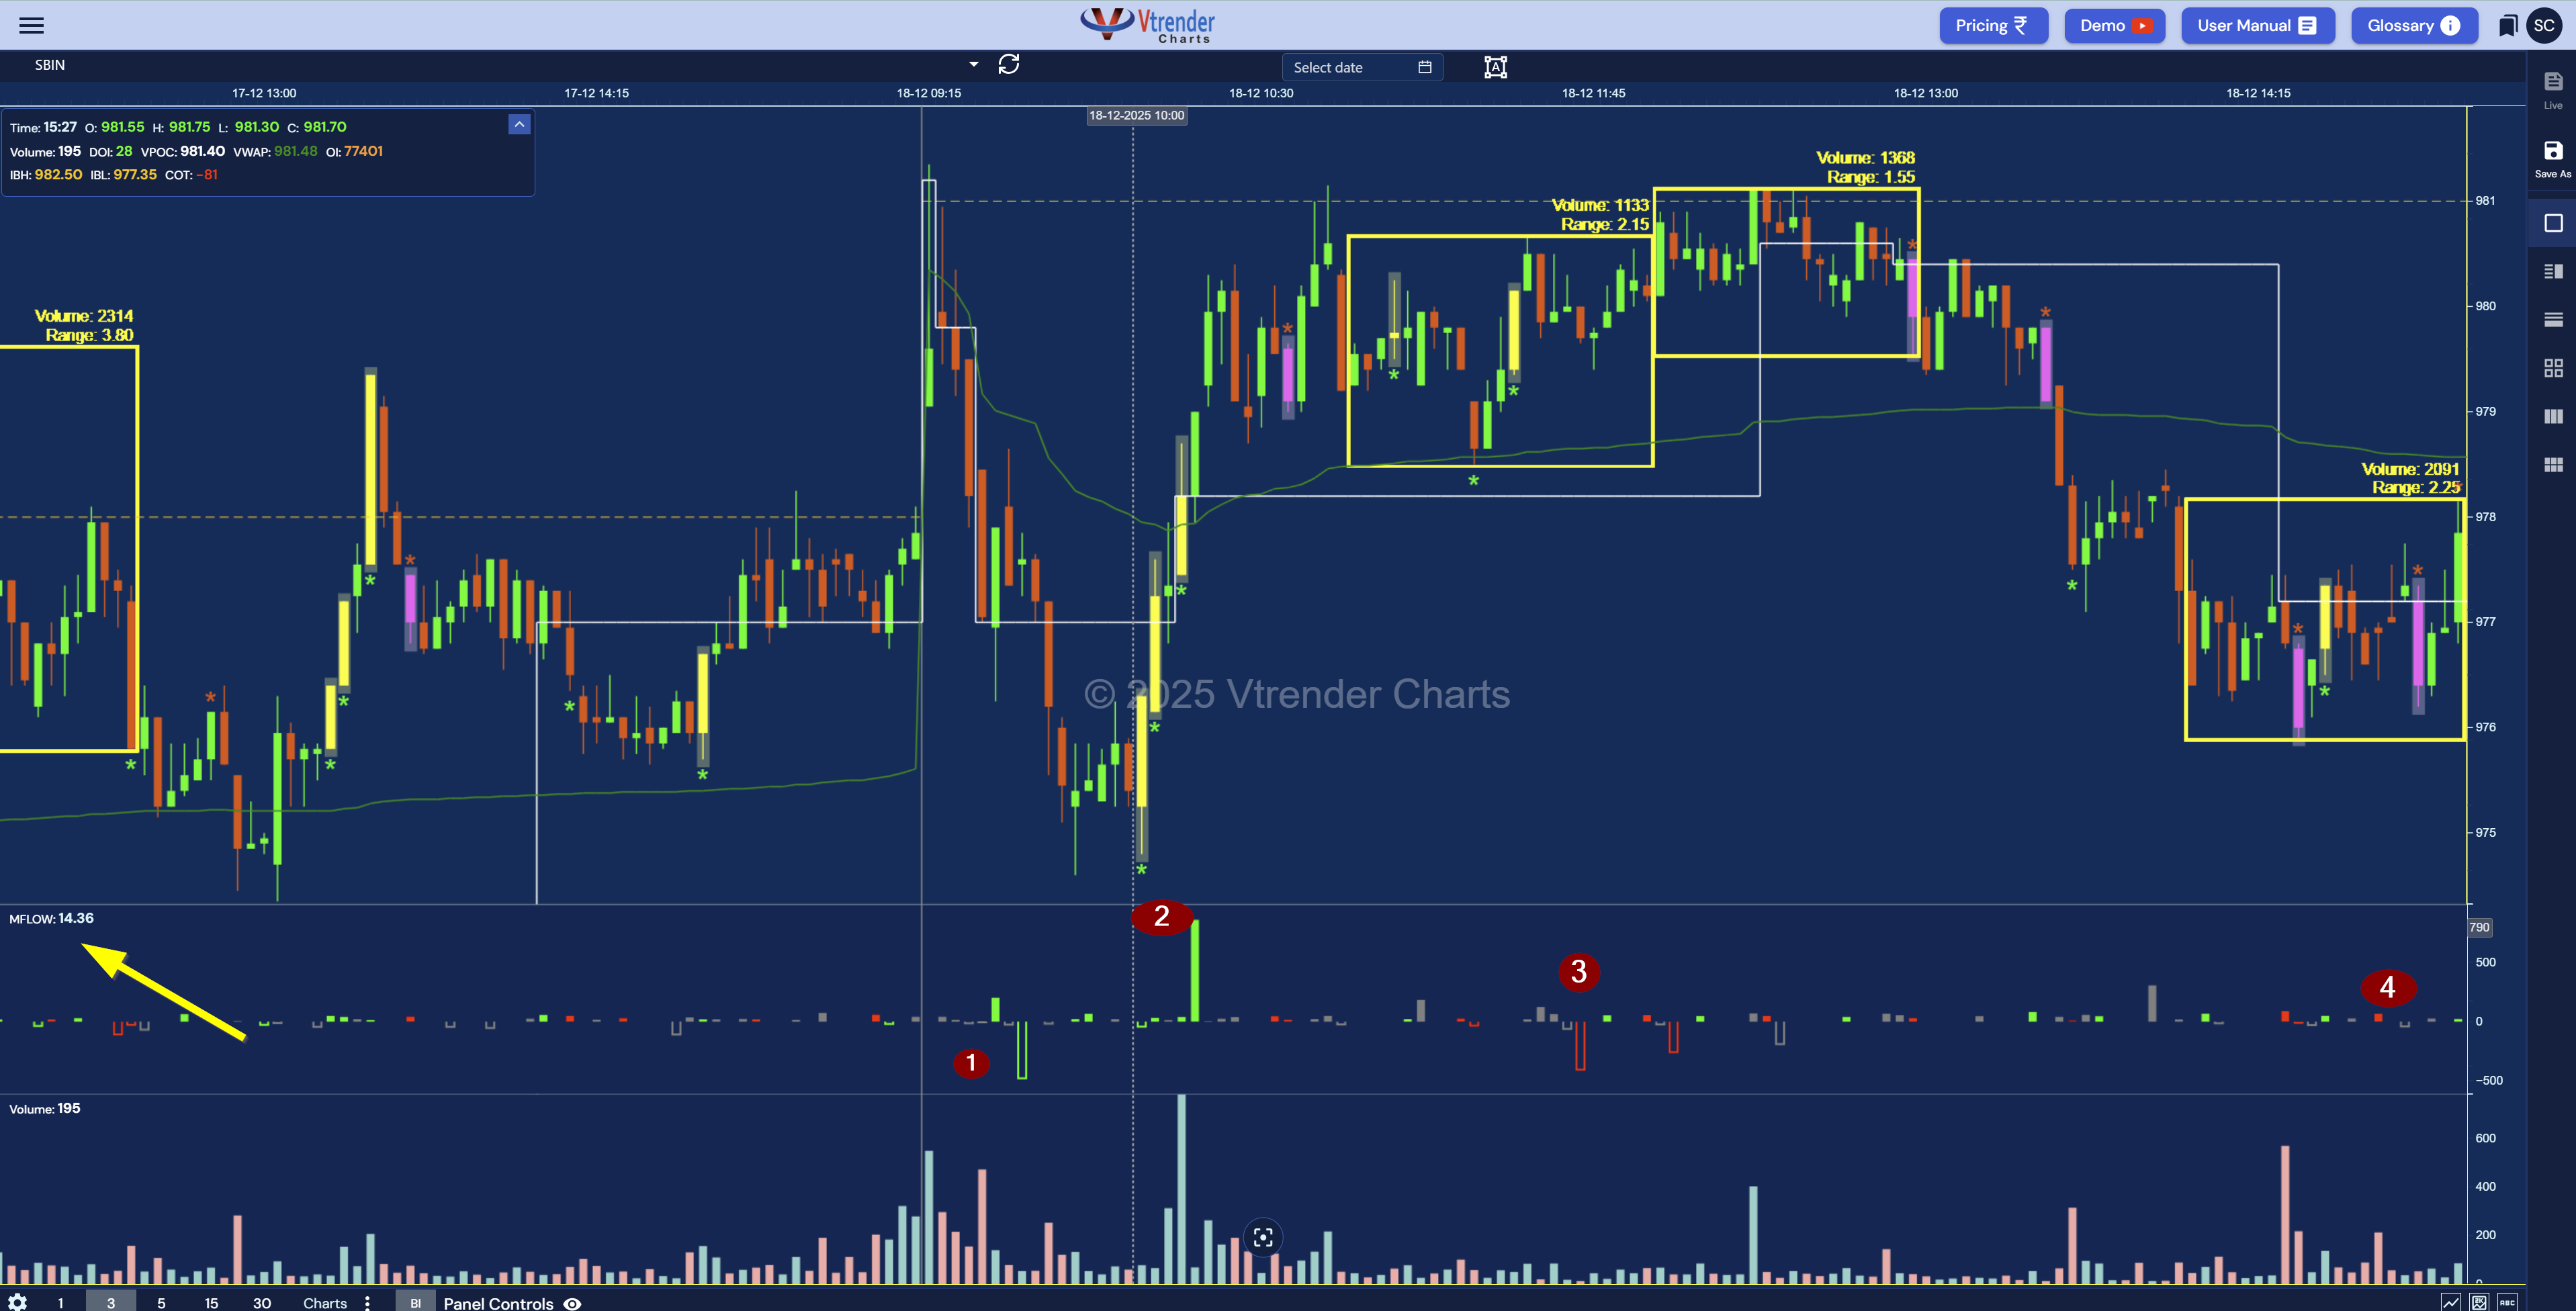
MFlow 2.0 is not built on end-of-bar or vendor-aggregated volume.
It’s powered by direct tick data from the exchange and a Vtrender-only algorithm that:
Breaks each bar’s volume into opening vs closing activity.
Separates longs vs shorts on both sides of the trade.
Tags each portion of volume as new business or old business.
The result is a histogram that doesn’t just say “volume was high” – it tells you who did what with that volume.
Old Business vs New Business is no longer a theory from Dalton;
It’s a live, visual signal on your options, futures, and stock charts.
Strong rally = Solid Green (new longs)
→ Fresh demand, move can extend.
Strong rally = Hollow Red (long liquidation)
→ Old longs exiting into strength, move may be running out of fuel.
Sharp sell-off = Solid Red (new shorts)
→ Bears building positions, trend risk increases.
Sharp sell-off = Hollow Green (short covering)
→ Shorts closing, selling pressure can dry up faster than price suggests.
Price tells you what happened.
MFlow 2.0 tells you who did it.
A series of solid red prints followed by a surge of hollow green
→ New shorts getting trapped and then forced to cover.
A series of solid green followed by hollow red
→ Late longs buying a top while smart money quietly exits.
For an options trader, this is the difference between
chasing the last leg of a move
and catching the unwind that follows it.
MFlow 2.0 takes the same volume everyone else sees and tells you whether it’s new longs, new shorts, short covering, or long liquidation – and which of those is worth trading with.
That’s the edge:
not just seeing that volume happened, but understanding who was behind it and what they were doing.
Ready to start reading New Business vs. Old Business in real-time? Our [MFlow 2.0 charts](https://vtrender.com/charts) classify every tick into solid green, solid red, hollow green, and hollow red, showing you exactly when smart money is entering vs. when they're exiting.
Want to master MFlow 2.0 systematically alongside Order Flow, Microbalance, and complete market structure analysis?
join us at the [Vtrender Live Desk](https://vtrender.com/live-desk) where we call out MFlow color changes, New Business vs. Old Business shifts, and positioning signals in real-time every session, helping you catch these setups as they develop. Stop guessing at volume. Start reading who's behind it.
MFLOW works best when paired with Market Profile. Market Profile tells where the auction is accepting price. MFLOW tells what kind of participation is driving that acceptance.
It also pairs with Smart Candlesticks, because Smart Candlesticks help place the MFLOW read inside familiar bar structure.
A practical MFLOW workflow:
Use Market Profile to locate value and rejection.
Use Order Flow to read aggressive buying or selling.
Use MFLOW to decide whether the move is new business or old business.
Use Smart Candlesticks to connect the read to execution bars.
Avoid treating all price movement as equal.
MFLOW does not replace price. It explains the participation behind price.
Read next: Understanding MFLOW and Order Flow PLR.
Read the full MFLOW guide and the Vtrender Learning Pathway. To study it live, open Vtrender Charts.

Markets don't move because indicators change.
Indicators change because markets move.
A practical reference for NSE & BSE derivatives traders. 366 pages, built to sit open beside live charts.