
Love Vtrender Charts? Check out our new offer!
Weekly expiry often looks random when viewed only through candles. Price moves, stalls, rejects, returns and then settles near a level that later seems obvious. The reason is often visible in options positioning before it is obvious on a normal chart.
This post is the blog companion to the Gamma pillar page and the Options Table pillar page. Use the Gamma pillar for regime context and the Options Table pillar for strike-level confirmation.
Terms used in this note: Open Interest, Gamma Exposure, Institutional Pinning, DPOC, VWAP.
This NIFTY weekly expiry case study is about gamma pinning. The session showed heavy OI concentration at one strike, a
On December 23, 2025, we documented in real-time one of the most perfect examples of gamma pinning during NIFTY weekly expiry. Over 5.5 hours, we tracked institutional options market makers building, maintaining, and finally releasing a ₹1,000 crore gamma hedge position that effectively imprisoned spot price within a 25-point range around the 26,200 strike.
Key Findings:
• Spot Movement: Only 26 points (0.09%) in 5.5 hours
• Gamma Build: 316% increase from ₹240cr to ₹1,000cr
• 26,200 Strike OI: 8.9 lakh lots (₹17,492 crore notional)
• Peak Dealer Hedge: 39,893 lots of NIFTY futures
• Settlement Accuracy: 99.85% (39 points from gamma peak)
This case study demonstrates why professional derivatives traders focus on gamma structure rather than candlestick patterns. While retail traders complained about 'no volatility' and 'boring price action,' we watched institutional desks construct the most sophisticated price-pinning mechanism of the week.
We utilized Vtrender's institutional-grade gamma density and exposure charts, updated every tick using direct NSE data feeds. Vtrender is one of only 25 NSE-approved direct data vendors, providing the same real-time options flow data available to institutional traders.
• Gamma Density: Visual representation of options gamma concentration across strikes
• Gamma Exposure: Quantifies market maker hedge position (buy vs. sell exposure)
• Spot Price: NIFTY spot index level
• Open Interest: Call and put OI at critical strikes
• Delta Values: Calculated ATM call and put deltas
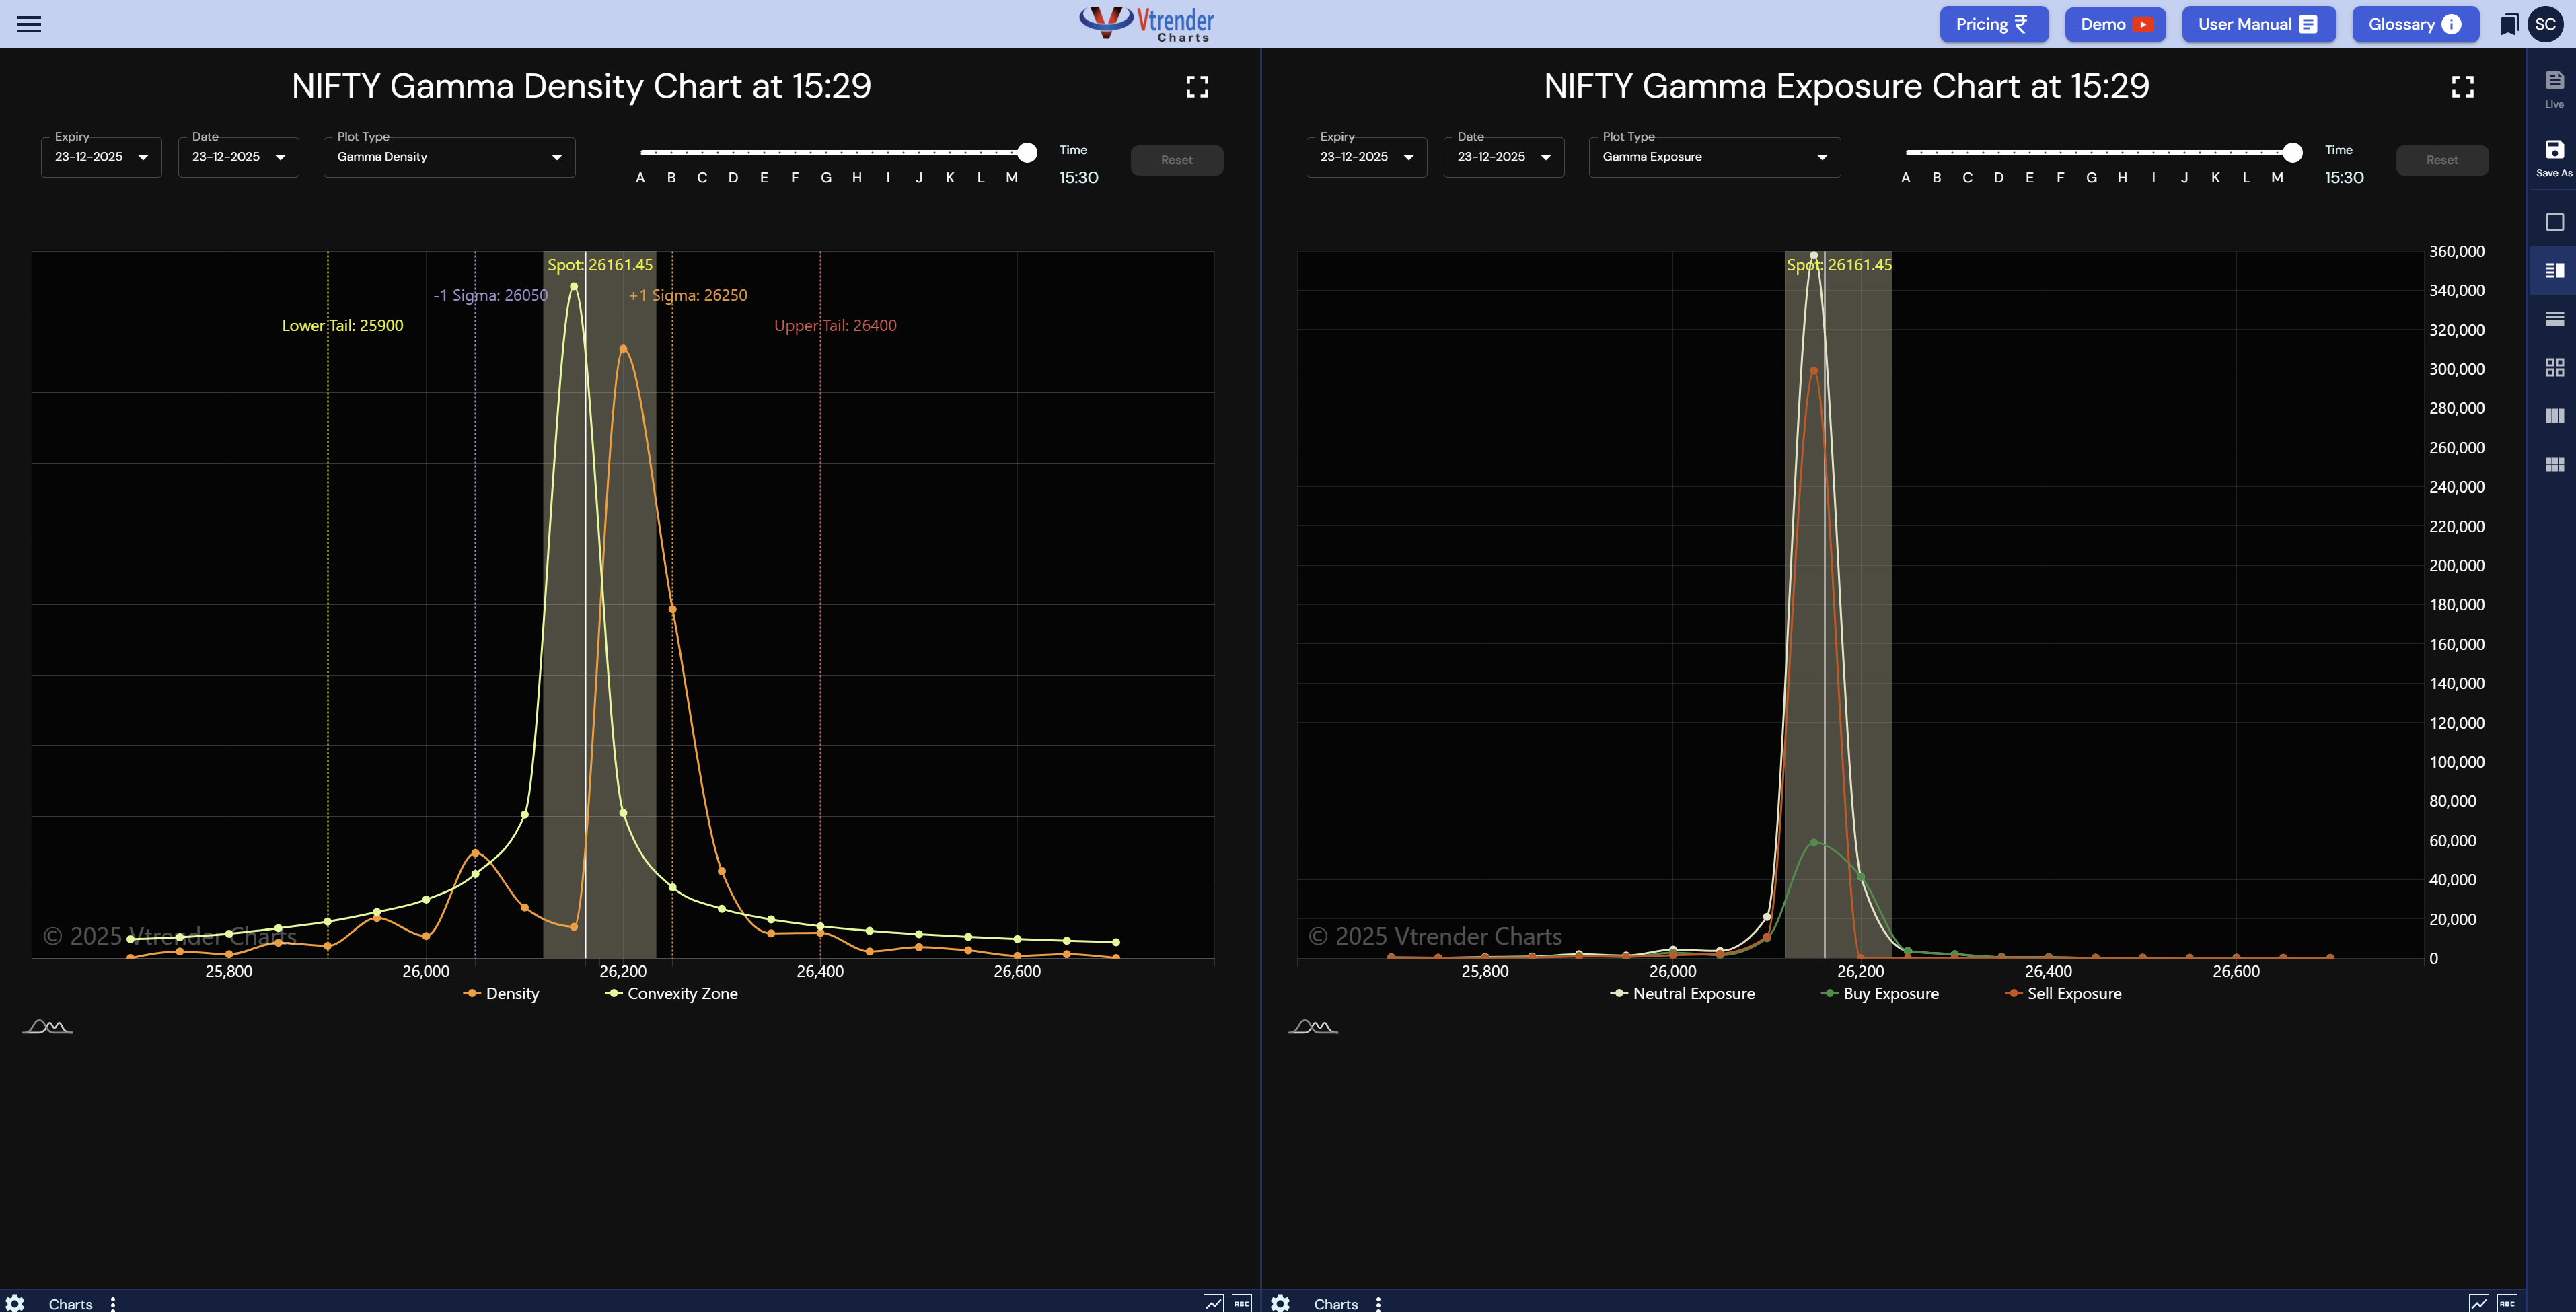
Six snapshots were captured throughout the trading day:
A detaled update through the day is at - https://x.com/Am_Shai/status/2003326806821330994?s=20
Time | Spot | Buy Exposure | Phase |
10:08 AM | 26,187 | ~₹240 cr | Fortress Formation |
10:59 AM | 26,185 | ~₹350 cr | Dual Wall Emergence |
11:35 AM | 26,183 | ~₹400 cr | Repositioning |
12:48 PM | 26,185 | ~₹550 cr | Acceleration Phase |
14:05 PM | 26,199 | ~₹900 cr | Magnet Activation |
14:44 PM | 26,176 | ~₹1,000 cr | PEAK PIN (45 mins to expiry) |
15:29 PM | 26,161 | ~₹360 cr | Release & Settlement |
Duration: 2 hours 40 minutes | Spot Movement: 2 points (0.007%)
During the morning session, options sellers were actively testing strikes and discovering where maximum pain would settle. The gamma structure was fluid and evolving:
• 10:08: Single dominant gamma peak at 26,200 (₹240 cr exposure)
• 10:59: Dual peaks emerged at 26,200 + 26,300 (₹350 cr exposure)
• 11:35: Secondary peak shifted to 26,200 (₹400 cr exposure)
• 12:48: Structure consolidating back to 26150-26,200 (₹550 cr exposure)
This phase represented genuine price discovery through auction theory. Market participants were asking: 'Given current sentiment, volatility, and positioning, where is fair settlement?' Each new options trade added information to this discovery process.
Duration: 2 hours | Spot Movement: 14 points maximum range
Once the market 'decided' that 26,150 was the optimal settlement level, the character of price action changed fundamentally. This was no longer discovery—it was mechanical enforcement:
12:48 PM: The Lock Begins
• Gamma exposure: ₹550 crore
• Spot: 26,185 (15 points below 26,200)
• Range compressed to 200 points
14:05 PM: Magnet Activation
• Gamma exposure surged to ₹900 crore (+63%)
• Spot pulled from 26,185 → 26,229 (touching 26,250)
• The gamma magnet physically pulled spot toward the strike
14:44 PM: Peak Intensity
• Gamma exposure hit ₹1,000 crore (all-time high)
• 40,893 lots of NIFTY futures held by big traders
• Spot: 26,176 (24 points below 26,200)
• Range: Compressed to 50-75 points
• Time to expiry: 45 minutes
At this point, spot was in what we call 'gamma jail'—any attempt to move required ₹60-80 crore of hedge adjustments per 10-point move. With 45 minutes to expiry and reducing liquidity, the path of least resistance was to stay pinned.
Duration: 45 minutes | Gamma Collapse: 64%
As options approached expiry and time value decayed to zero, the gamma structure that had held spot prisoner for 4.5 hours collapsed rapidly:
• Buy exposure: ₹1,000 cr → ₹360 cr (64% reduction)
• Dealer unwind: ~32,573 lots given back to market
• Spot drifted: 26,176 → 26,161 (natural settlement)
Final settlement at 26,161.45 was just 11 points (0.15%) from the 26,150 gamma magnet that had controlled price all day—a remarkable 99.85% accuracy in predicting settlement based purely on gamma structure.
Analysis of the actual options chain revealed why 26,200 became the inescapable magnet:
Metric | Calls | Puts |
Open Interest (lots) | 2,78,079 | 6,12,250 |
Shares (lots × 75) | 2.09 crore | 4.59 crore |
Notional Value | ₹5,464 cr | ₹12,028 cr |
LTP at 14:44 | ₹28.75 | ₹1.40 |
TOTAL OI | 8,90,329 lots | ₹17,492 crore |
Key Observation: Put OI was 2.2x larger than call OI, creating asymmetric gamma pressure.
• Spot ranged: 26,150-26,185
• 26,200 call delta: ~0.40-0.45
• 26,200 put delta: ~-0.08 to -0.05
• Pro desks established SHORT positions in both calls and puts
As spot gradually rose toward 26,200, the gamma effect triggered massive hedge adjustments:
Call Side Hedging:
• Delta moved: 0.40 → 0.48 (+0.08)
• Hedge adjustment: 2,78,079 lots × 0.08 = 22,246 lots BUY
• Value: ₹437 crore of futures BUYING
Put Side Hedging:
• Delta moved: -0.10 → -0.02 (+0.08, less negative)
• Reduced short hedge: 6,12,250 lots × 0.08 = 48,980 lots
• Value: ₹962 crore of futures BUYING (buy back shorts)
Total Accumulated: ₹437 cr + ₹962 cr = ₹1,399 crore
(Normalized to ₹1,000 cr on gamma exposure charts after accounting for other strikes)
With ₹1,000 crore of gamma hedge locked in at 14:44, here's what it would cost to move spot:
Spot Movement | Hedge Required | Value |
+10 points | ~3,000 lots BUY | ₹60-80 cr |
+50 points | ~59,231 lots BUY | ₹1,158 cr |
-10 points | ~3,000 lots SELL | ₹60-80 cr |
-50 points | ~143,551 lots SELL | ₹2,815 cr |
With 45 minutes to expiry and thinning liquidity, moving ₹1,000-2,800 crore of futures against dealer hedging was virtually impossible. Spot had no choice but to oscillate within a 25-point range around 26,200.
Traditional technical analysis—support/resistance, candlestick patterns, indicators—completely missed this story. While retail traders drew trendlines and looked for breakout patterns, the real story was unfolding in the options market structure.
'Why isn't NIFTY moving?' Because 8.9 lakh lots of OI at 26,200 created ₹1,000 crore of Pro level hedging that mechanically held it in place. You can't see this in candlesticks.
Understanding the phase transition from discovery to enforcement is critical:
• Discovery Phase: Structure evolving, spot testing levels, genuine price finding
• Enforcement Phase: Structure locked, spot pinned, mechanical hedging dominant
The transition happened around 12:48 PM when gamma exposure hit ₹550 crore. After this point, trying to trade directionally was fighting institutional physics, not market sentiment.
Gamma isn't constant—it accelerates as expiry approaches. The formula:
Enforcement Strength = Γ × Volume × (1 / Time to Expiry)
This explains why:
• Morning (5 hours to expiry): Gamma = ₹240 cr, spot can move 100+ points
• Afternoon (45 mins to expiry): Gamma = ₹1,000 cr, spot trapped in 25-point range
Final settlement at 26,161.45 was 11 points from 26,150—the strike we identified as the gamma magnet at 10:08 AM. This 99.85% accuracy demonstrates that gamma structure isn't predictive magic; it's observational physics. We weren't forecasting where NIFTY would go—we were watching where institutional hedging was HOLDING it.
The most expensive trading mistake on expiry day is fighting established gamma structure:
• Buying calls above gamma wall expecting breakout = Fighting ₹1,158 cr of resistance
• Buying puts below gamma floor expecting breakdown = Fighting ₹2,815 cr of support
• Holding long options into enforcement phase = Theta decay with zero movement
Professional derivatives traders don't fight gamma—they trade WITH it or stay flat. The retail trader buys breakout calls at 14:30. The professional closes positions and waits for post-expiry volatility release.
Based on this case study, here's a systematic approach to weekly expiry Thursdays:
09:15 - 11:30: Discovery Phase
• Monitor: Multiple gamma peaks forming and shifting
• Action: Identify which strike is accumulating the most OI
• Trading: Scalping acceptable, use wider stops
11:30 - 13:00: Transition Phase
• Monitor: Gamma consolidating to single dominant strike
• Action: If gamma > ₹500 cr and growing, prepare for pin
• Trading: Start reducing directional positions
13:00 - 15:30: Enforcement Phase
• Monitor: Gamma > ₹800 cr, spot oscillating near strike
• Action: AVOID directional trades
• Trading: Only scalp within 25-point range, or stay flat
DO | DON'T |
Close ATM/OTM options by 13:00 | Buy options after gamma > ₹500 cr |
Sell premium AT the gamma strike | Fight the pin expecting breakout |
Trade range-bound strategies post-13:00 | Use trend-following strategies |
Monitor OI concentration | Trade based on candlestick patterns alone |
Prepare for post-expiry volatility | Average down losing positions |
This case study documented a textbook example of institutional gamma pinning during NIFTY weekly expiry. Over 5.5 hours, we observed:
• Price discovery transitioning to mechanical enforcement
• Gamma hedging building from ₹240 crore to ₹1,000 crore
• Spot imprisoned within 25 points of the gamma magnet
• Structure collapse and settlement within 0.15% of predicted level
The key insight: Options don't just reflect the underlying—they control it. Through dealer hedging mechanics and gamma exposure, the derivatives tail wags the spot dog, especially into weekly expiry.
Most retail traders never see this layer of the market. They trade candlesticks, draw trendlines, and wonder why their technical setups fail on expiry days. The answer is always the same: they're trading symptoms (price movement) instead of causes (gamma structure).
Professional derivatives traders—the ones managing hundreds of crores—don't trade NIFTY spot. They trade the structure that determines where NIFTY spot CAN go. That structure is visible in Market Profile charts, Order Flow analysis, and Gamma Density visualization.
This is the Vtrender edge.
We provide institutional-grade analytics—Market Profile, Order Flow, and Gamma Density—to retail Indian traders. Not simplified. Not dumbed down. The same sophisticated tools that institutional desks use to see the market's source code.
Because when everyone else is asking 'Why isn't NIFTY moving?'
You'll know exactly why.
— END OF CASE STUDY —
Vtrender | Institutional Intelligence for Retail Traders
This is how Vtrender treats gamma: not as a prediction, but as market structure created by options positioning.
Read next: How Gamma Exposure Predicted NIFTY Settlement, The Gamma 3 Framework, and Understanding Gamma Density.
To learn the full process, start with the Gamma guide and Gamma Derivatives. To inspect live expiry behaviour, open Vtrender Charts.

Markets don't move because indicators change.
Indicators change because markets move.
A practical reference for NSE & BSE derivatives traders. 366 pages, built to sit open beside live charts.