
Love Vtrender Charts? Check out our new offer!
Most traders learn options through Delta first. Delta tells us how much an option changes when price changes. But serious options reading needs the next layer: Gamma.
Gamma explains how Delta itself changes. In index options, that change can create pressure around strikes, hedging zones, pinning areas and acceleration points. On Vtrender, we use a three-part Gamma framework: Gamma Density, Gamma Exposure and Convexity.
This post is the blog companion to the Gamma pillar page and the Gamma Derivatives pillar page. Read those pillars when you want the full framework, and use this note as the short map of Density, Exposure and Convexity.
Terms used in this note: Gamma Density, Gamma Exposure, Convexity, Long Gamma, Short Gamma.
Gamma measures the rate of change in an option's delta.
Delta is speed—how fast an option's price moves relative to the underlying.
Gamma is acceleration—how quickly that speed changes.
Positions in NSE options come from:
Proprietary trading desks
Institutional participants
Experienced retail traders
No obligated dealers. No forced market making. Every position exists because someone chose to place it. All trades are direct—no pools, no intermediaries.
This makes positioning data readable.
A deep dive into Gamma is at - https://vtrender.com/pillar/gamma
Gamma density shows where option positioning is concentrated.
High density at a price level:
Many participants hold positions there
Price tends to slow near that area
Markets rotate, pause, or spend time there
The taller and narrower the peak, the stronger the gravitational effect. Settlement tends toward density peaks.
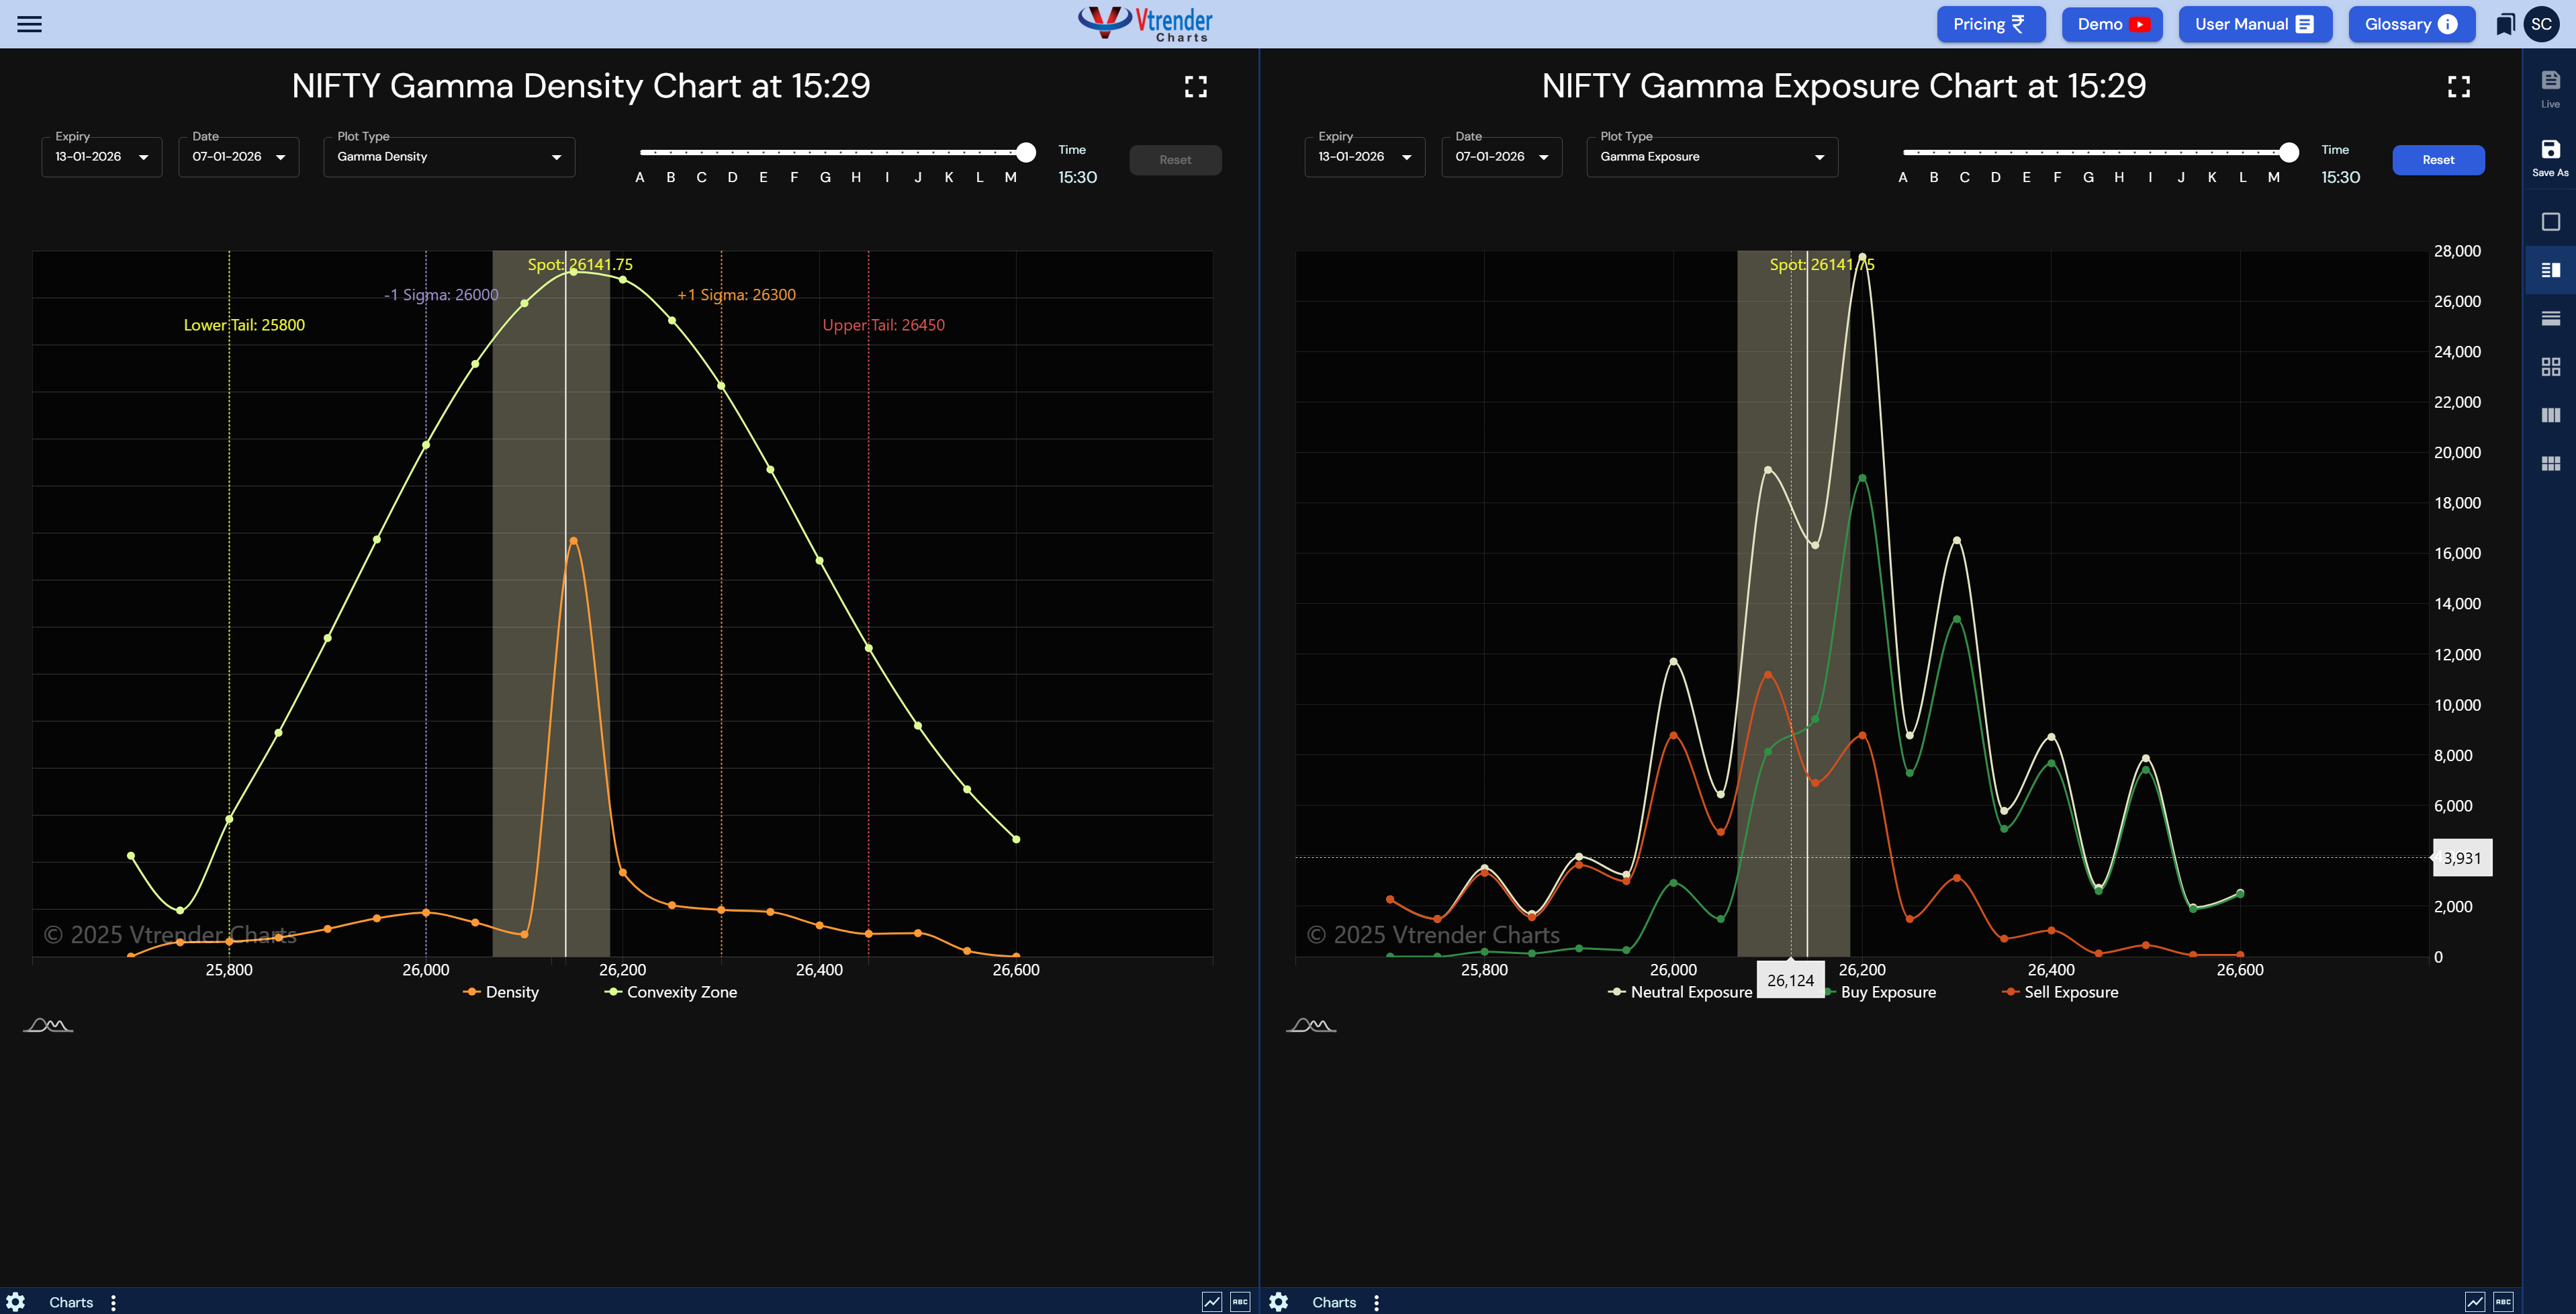
Gamma exposure shows whether participants are long or short gamma at specific strikes, and the magnitude of that exposure.
It indicates:
Market response if price rises from current level
Market response if price falls from current level
Where stability preference exists
This is why some moves continue smoothly, some stall quickly, and some levels feel calm while others feel reactive.
Check our case study on how we use Gamma density and Gamma expsoure togther- https://vtrender.com/posts/how-gamma-exposure-predicted-nifty-settlement-with-pinpoint-accuracy
Gamma convexity describes the shape of risk around price.
Narrow convexity—price movement tends to be controlled.
Wide convexity—price moves more freely.
Convexity measures the effort required for price to travel.
Component | What It Shows |
|---|---|
Density | Where risk is concentrated |
Exposure | How movement will be handled |
Convexity | How difficult movement will be |
Together, they form a picture of market structure before price moves.
Tools
Gamma density, exposure, and convexity for NIFTY are available in Vtrender Charts.
The mistake is to read these three layers separately. Gamma Density without Gamma Exposure only shows where pressure sits. Gamma Exposure without Convexity may miss how quickly that pressure can change. Convexity without location becomes abstract.
The workflow is:
Use Gamma Density to identify important strike zones.
Use Gamma Exposure to judge whether the market is in a pinning or expansion regime.
Use Gamma Derivatives to read convexity and expected-move bands.
Check the
Options Table for OI, volume, dOI and strike-level confirmation.
Use
Market Profile to see whether price is accepting or rejecting the gamma zone.
This is why Gamma is not just an options Greek. For an index trader, it becomes a map of where positioning can control price behaviour.
Read next: How Gamma Exposure Predicted NIFTY Settlement, Understanding Gamma Density, and Understanding Gamma Exposure.
Read the complete Gamma guide and the deeper Gamma Derivatives guide.
To see the framework live, open Vtrender Charts.

Markets don't move because indicators change.
Indicators change because markets move.
A practical reference for NSE & BSE derivatives traders. 366 pages, built to sit open beside live charts.