Sell in May? Yes, the clock gets it right this time
They say a broken clock is also right two times a day.
In the markets, you can be right and you can be wrong but you can never be entirely right and will never be entirely wrong also.
Sometimes, the elements come together for you and make it right.
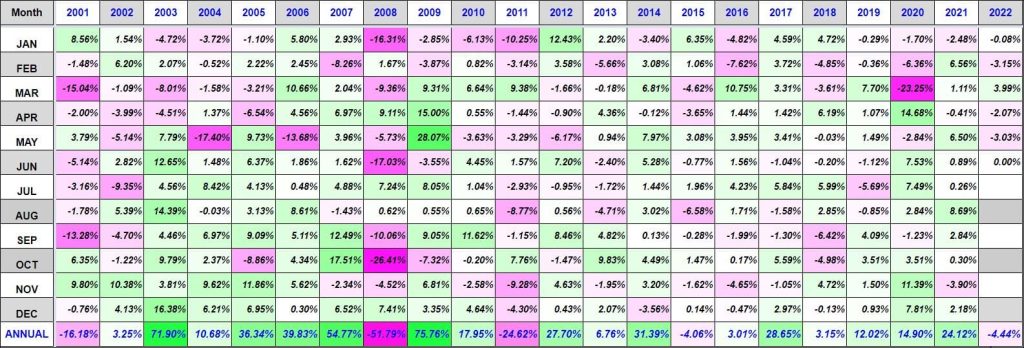
The oft repeated ” sell in May and go away” rang true for May 2022 and the index was down 6.23% in May, making it the biggest drop of the year, index wise.
But has it always been so bad?
Data suggests this is not true.
Have a look at this chart below and focus on the row marked “may” and you will see that there is little truth to what the marked wisdom says on that one.

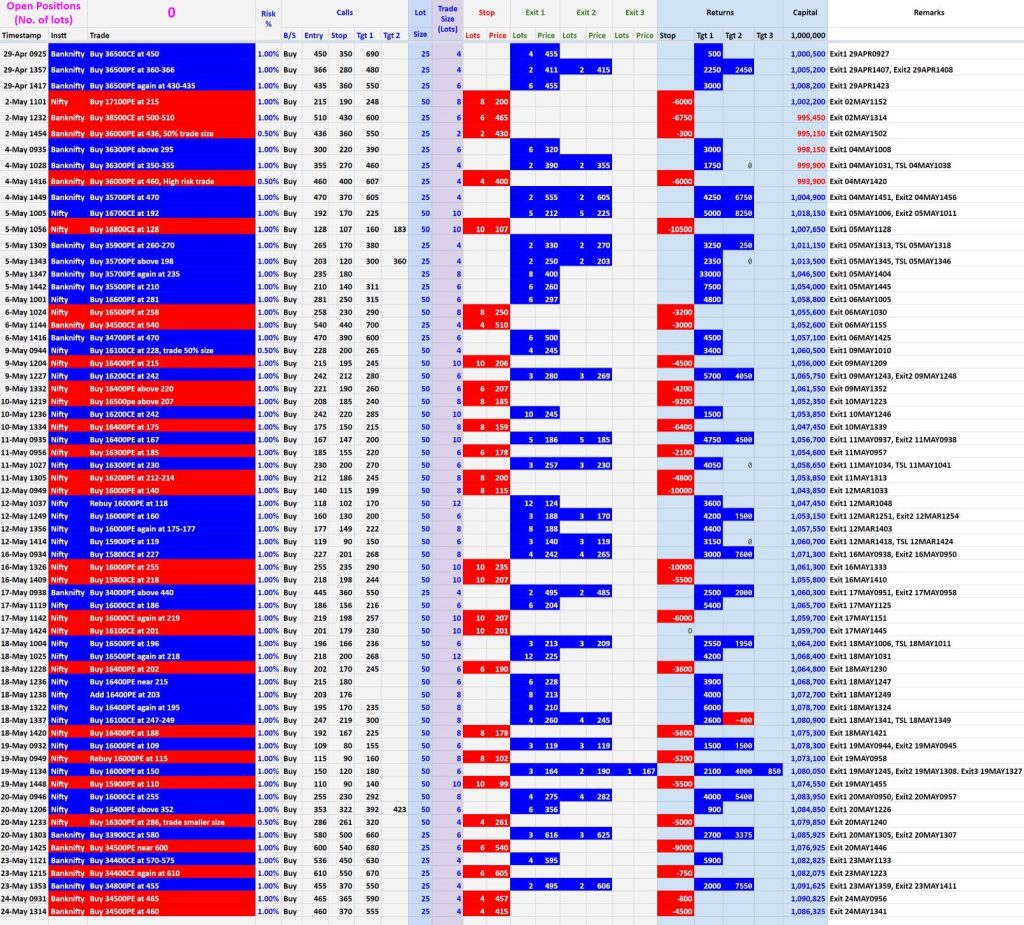
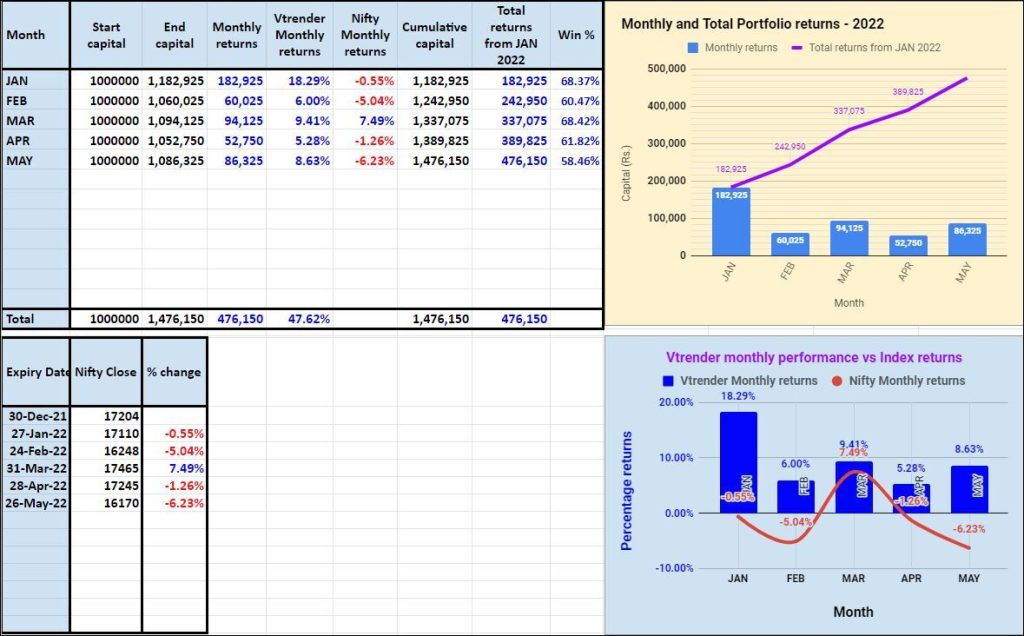
How did we do in May?
We trade on a Process which follows the market closely and we are there right behind following it.
Key words over there are “following behind”
Follow too far away , the market turns and comes headlong into you and you are washed out
Follow a step or 2 behind, and you are just about fine.
You miss out on the glory of calling the “top” and the “bottom”, which are misnomers actually, cos there is never a top in the market, though a bottom of 0 is part of the debate. But you are not here for the glory and the thrill, cos there are plenty of other things in life to give you a thrill. This is a business and needs iron clad rules of engagement
Which is why we went to work on the #Orderflow system allowing us to watch and follow the market closely and do the “follow behind” correctly, not too far away, just about close.
And this #Orderflow helps us to stay profitable every month. It’s the system and if the market turns down we turn down and it goes up, we go up. It’s effective and we are happy in being followers and disciples of the market.

We work the system every month through the #Orderflow to ensure that the market pays us everymonth.
we are happy to make a little more than what the market moves by everymonth.
That is our goal.
The strategy is to do this every month, month on month , and ensure that we do not give back to the market what we make.

How does the #Orderflow actually do this for you?
The #Orderflow follows the market.
Volumes Precede Price
Volumes can be measure as Buy Side Volumes also called Demand and sell side Volumes also called Supply
Orderflow tracks Demand and Supply
Higher demand pushes prices higher
Higher supply pushes prices lower
when demand and supply are even, prices do not move much
So that’s our secret.
We changed the #Orderflow charts commonly available in the market and filled with words like “delta”, “cumulative delta”, “imbalance” etc etc and etc – all good sounding words but not able to show us the demand and supply live, to something which could show this demand and supply live.
And we took this information and placed it in the #Orderflow bands at the top.
Now if the band was blue, it showed more demand coming in and if it was red, it showed more supply. If grey we knew we had to wait.
Some examples of how these charts work are at https://www.vtrender.com/features/
It's that simple, but is it?
It’s not simple and the system behind it is measured and heavy.
It previously used to take me upto 6 minutes to run one iteration of the cycle. That’s why we could not have it earlier. 6 minute delay is a lifetime in our markets.
But now we have speeded it up and the bands are real time and fast.
we need to thank technology for that.
Live every day
To see the #Orderflow charts in action in a live market, head over to https://www.vtrender.com/trading-room/
