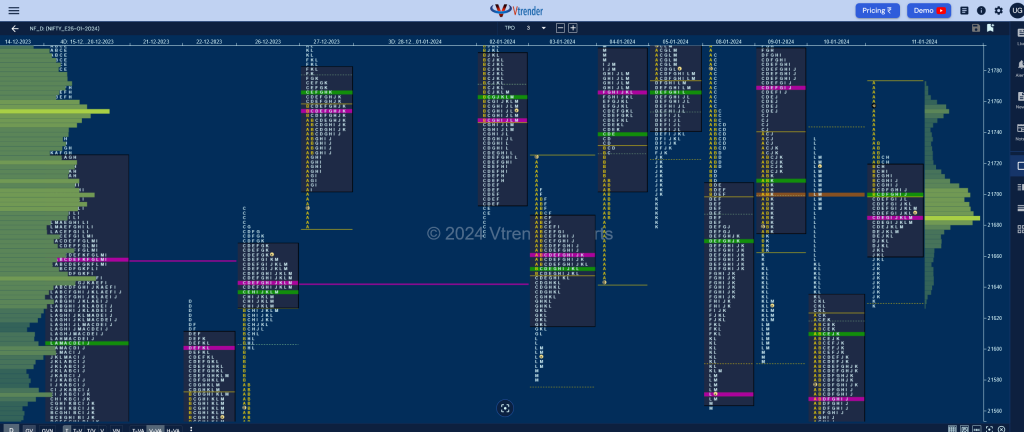
Nifty Jan F: 21678 [ 21773 / 21627 ]

| Open Type |
|---|
| OAOR (Open Auction Out of Range) |
| Volumes of 13,761 contracts |
| Initial Balance |
|---|
| 73 points (21773 – 21700) |
| Volumes of 29,364 contracts |
| Day Type |
|---|
| Normal Variation – 147 points |
| Volumes of 1,13,071 contracts |
NF gave a follow up to previous session’s spike close as it opened higher tagging 09th Jan’s VPOC of 21770 while making a high of 21773 but did not find any fresh demand and settled down into an OAOR forming a narrow 74 point range IB (Initial Balance) getting back into the spike zone making lower lows till the D period where it hit 21666 taking support just above the extension handle of 21658.
The auction then made a retracement back above day’s VWAP in the following 4 TPOs making higher highs but could only manage to tag 21723 stalling just below the A period selling tail of morning leaving a PBH (Pull Back High) there reversing the probe once again to the downside as it went on to make fresh REs (Range Extension) in the J & K periods almost completing the 2 IB target of 21626 while making a low of 21627.
However, previous day’s VWAP being held meant some demand coming back in this zone which caused a bounce back to day’s VWAP into the close leaving a ‘b’ shape profile for the day with Value forming completely higher and in the spike zone. The last 2 sessions have got Initiative tails at opposite ends which are from 21528 on the downside and 21734 on the upside which will be the extreme levels to watch out for in the coming sessions with the VWAPs of 21611 & 21699 being the immediate references for the next open.
Click here to view the latest profile in NF on Vtrender Charts
Daily Zones
- Largest volume (POC) was traded at 21686 F and VWAP of the session was at 21699
- Value zones (volume profile) are at 21662-21686-21719
- HVNs are at 21754** / 21890 (** denotes series POC)
Weekly Zones
- (05-11 Jan) – NF has formed a Normal Variation profile to the downside which made a look down below previous lows but left an initaitive buying tail on the daily timeframe from 21528 to 21501 forming a nice balance over the 5 days with Value being completely inside at 21635-21703-21797 and this week’s VWAP also around the middle at 21690 where it closed and will need initiative volumes at one end in the coming week for a fresh imbalance to begin
- (29 Dec-04 Jan) – NF has formed a Neutral Centre weekly profile as it made a look up above previous highs but got rejected after making new ATH of 22025 and went on to make a low of 21579 taking support right above last week’s lower TPO HVN of 21570 filling up the low volumes zones and forming mostly overlapping Value at 21640-21748-21875 with a point to note that the sellers who had come in forming a base at 21890 had mostly booked profits at lower levels where it saw some short covering and fresh demand coming back.
Monthly Zones
- The settlement day Roll Over point (January 2024) is 21930
- The VWAP & POC of Dec 2023 Series is 21226 & 21377 respectively
- The VWAP & POC of Nov 2023 Series is 19562 & 19806 respectively
- The VWAP & POC of Oct 2023 Series is 19468 & 19537 respectively
Business Areas for 12th Jan 2024
| Up |
| 21699 – VWAP from 11 Jan 21734 – Selling Tail (11 Jan) 21784 – SOC from 09 Jan 21816 – Selling Tail (05 Jan) 21874 – 3-day VAL (28Dec-01Jan) |
| Down |
| 21670 – J TPO POC (11 Jan) 21611 – VWAP from 10 Jan 21569 – dPOC from 10 Jan 21528 – Buy Tail (10 Jan) 21484 – J TPO VWAP (22 Dec) |
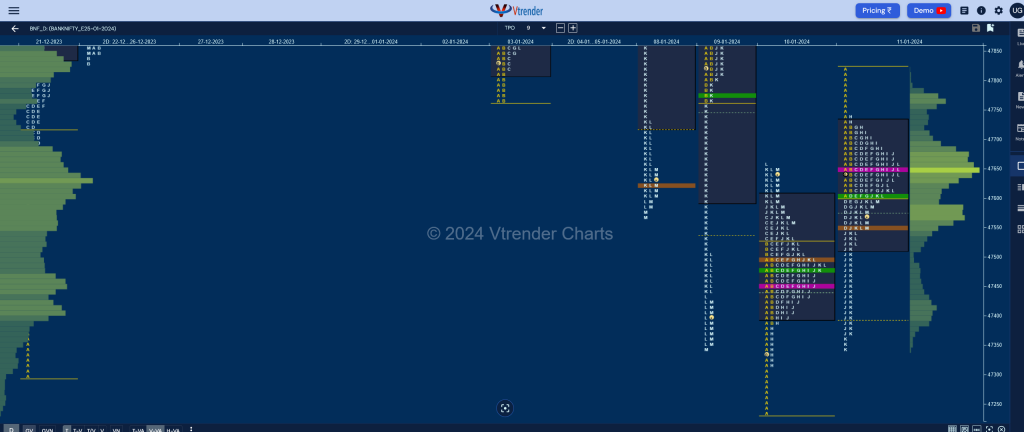
BankNifty Jan F: 47573 [ 47822 / 47340 ]

| Open Type |
|---|
| OAOR (Open Auction Out of Range) |
| Volumes of 12,989 contracts |
| Initial Balance |
|---|
| 220 points (47822 – 47603) |
| Volumes of 28,744 contracts |
| Day Type |
|---|
| Normal Variation – 482 points |
| Volumes of 1,12,409 contracts |
BNF made a jump of 160 points at the open and went on to tag the NeuX VWAP of 47778 from 09th Jan but could only manage to hit 47822 as the sellers came back in this zone and pushed it lower closing the gap and forcing an entry into previous value as it made a RE lower to 47550 in the D period.
The auction then made a bounce back above day’s VWAP in the G & H TPOs testing the initiative selling tail of morning from 47724 to 47822 but could only leave a PBH at 47740 indicating that the sellers were in control after which it made a big RE to the downside in the J period swiping through previous Value and went on to make a lower low of 47340 in the K stalling just above the buying singles from 10th Jan.
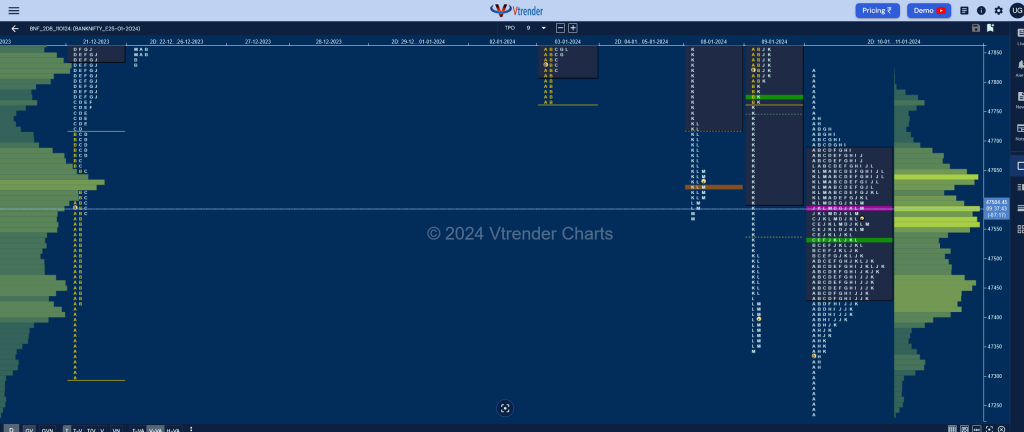
BNF then made a bounce back to day’s POC of 47652 in the L period before settling down to close right at halfback of the day leaving a ‘b’ shape structure which means long liquidation with overlapping to higher Value whereas on the 2-day composite we have a nice 3-1-3 profile being formed which could see some more filling up happening in the Value area zone of 47435-47591-47685 before we get a move away from this balance in the coming session(s). (Click here to view the MarketProfile composite only on Vtrender Charts)

Click here to view the latest profile in BNF on Vtrender Charts
Daily Zones
- Largest volume (POC) was traded at 47652 F and VWAP of the session was at 47608
- Value zones (volume profile) are at 47518-47652-47731
- HVNs are at 47956 / 48005** / 48555 (** denotes series POC)
Weekly Zones
- (04-10 Jan) – BNF has once again formed a Neutral Extreme Down weekly profile which first filled up the low volume zone of previous week and then went on repair the poor lows with a sharp move lower testing the swing lows of 47303 (21-28 Dec) while tagging 47201 before giving a bounce back to 47666 into the close. Value for the week was completely overlapping at 47670-48076-48601 with the main supply reference being at the NeuX VWAP of 47970
- (29 Dec-03 Jan) – BNF has formed a Neutral Extreme which also reresents a Double Distribution Trend Down profile which got stalled right below previous week’s POC of 48879 on the upside and went on to fill the low volume zone till 48446 and made an initiative move with a small selling tail from 48346 to 48256 as it went on to make poor lows at 47763 forming a lower balance with the POC also shifting down to 47956. Value for the week was at 47765-47956-48542 with the important DD VWAP being at 48278 which will be the swing reference for the coming settlement.
Monthly Zones
- The settlement day Roll Over point (January 2024) is 48900
- The VWAP & POC of Dec 2023 Series is 47337 & 47918 respectively
- The VWAP & POC of Nov 2023 Series is 43837 & 43619 respectively
- The VWAP & POC of Oct 2023 Series is 43718 & 44346 respectively
Business Areas for 12th Jan 2024
| Up |
| 47608 – VWAP from 11 Jan 47740 – Selling Tail (11 Jan) 47915 – J TPO VWAP (09 Jan) 48017 – VPOC from 09 Jan 48117 – Selling tail (09 Jan) |
| Down |
| 47567 – L TPO POC (11 Jan) 47413 – K TPO POC (11 Jan) 47321 – Buying Tail (10 Jan) 47201 – Swing Low (10 Jan) 47085 – C TPO POC (07 Dec) |
You can check the monthly charts & other swing levels for both Nifty & BankNifty here & for the weekly charts & analysis, please click here.
