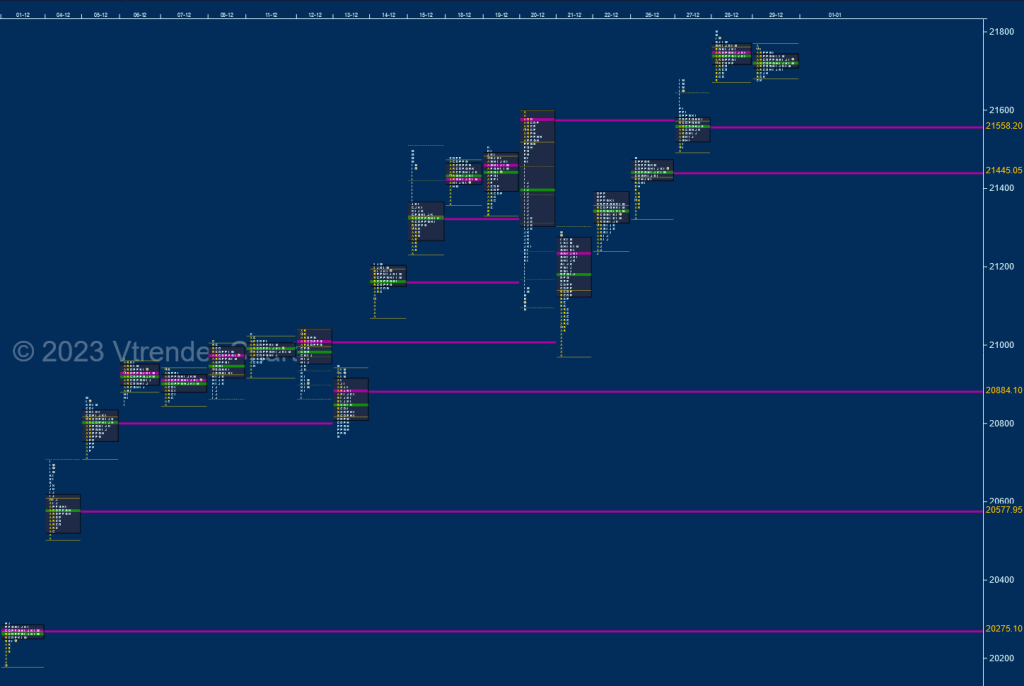
Nifty Dec Spot: 21731 [ 21801 / 20183 ]
Previous month’s report ended with this ‘The Monthly Profile is a Trend Up one with an initiative buying tail from 19064 to 18973 along with 3 extension handles at 19096, 19175 & 19276 after which it went on to complete the 80% Rule in the 4-month composite Value of 19330-19542-19792 with the help of another extension handle at 19494 and a zone of singles till 19614 as it formed similar highs at 19875 in the third & fourth week. The final week however saw a fresh imbalance after the confirmation of a FA at 19800 leading to 3 more extension handles at 19875, 19916 & 20104 with Nifty closing around the highs of 20158 and in total contrast to previous month where it closed away from the 4-month Value on the downside but failed to give any follow through after testing that long term buy side extension handle of 18887 enabling the buyers to strike back as the formed a huge 1185 point range in November with a strong chance of the imbalance continuing although Value was once again overlapping at 19349-19806-19916 with the series VWAP being at 19652 and will be a swing reference not just for the next month but also for the year 2024‘

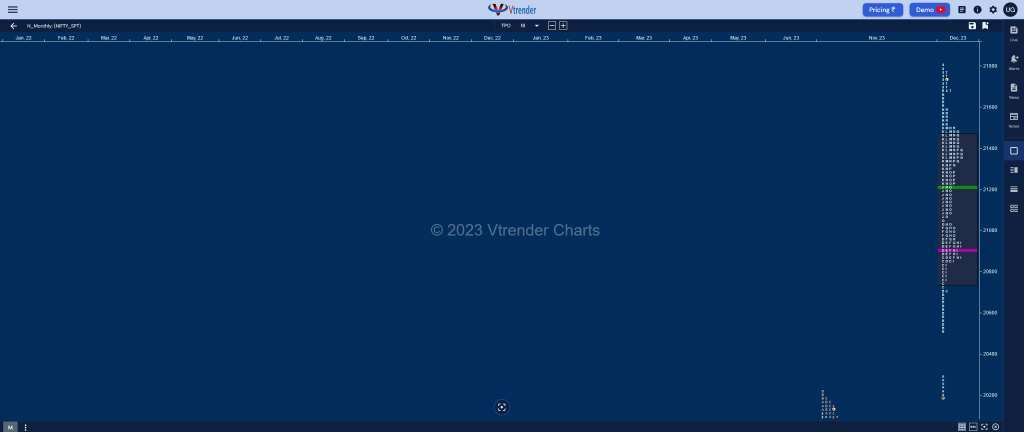
Nifty has formed a Triple Distribution Trend Up profile on the monthly with completely higher Value at 20740-21377-21458 as it made a move away from the 5 month composite (july to November 2023) with the help of a huge initiative buying tail from 20769 to 20183 on the higher timeframe with the zone also including couple of daily VPOCs at 20275 & 20578 from 01st & 04th Dec respectively after which it formed a balance over the next 7 days building a composite POC at 20914 after which the auction resumed the upmove from 14th Dec making a fresh move higher till 20th where it made a record high of 21593 but left an A period selling tail triggering a liquidation drop down to 20976 on 21st Dec and saw demand coming back with an initiative buying tail till 21036 which started a fresh impulse higher into the close of the month and was helped with a daily FA at 21232 on 22nd and couple of VPOCs at 21445 & 21558 on 26th & 27th which saw it take out 20th highs of 21593 and record new highs of 21801 on 28th Dec. However, it formed back to back Normal days leaving a 2-day balance at the top with a close right at the prominent POC of 21732 which will be the immediate reference as we start the new year 2024.

Monthly Zones
- The settlement day Roll Over point (January 2024) is 21930
- The VWAP & POC of Dec 2023 Series is 21226 & 21377 respectively
- The VWAP & POC of Nov 2023 Series is 19652 & 19806 respectively
- The VWAP & POC of Oct 2023 Series is 19468 & 19537 respectively
- The VWAP & POC of Sep 2023 Series is 19736 & 19672 respectively
- The VWAP & POC of Aug 2023 Series is 19440 & 19424 respectively
- The VWAP & POC of Jul 2023 Series is 19600 & 19430 respectively
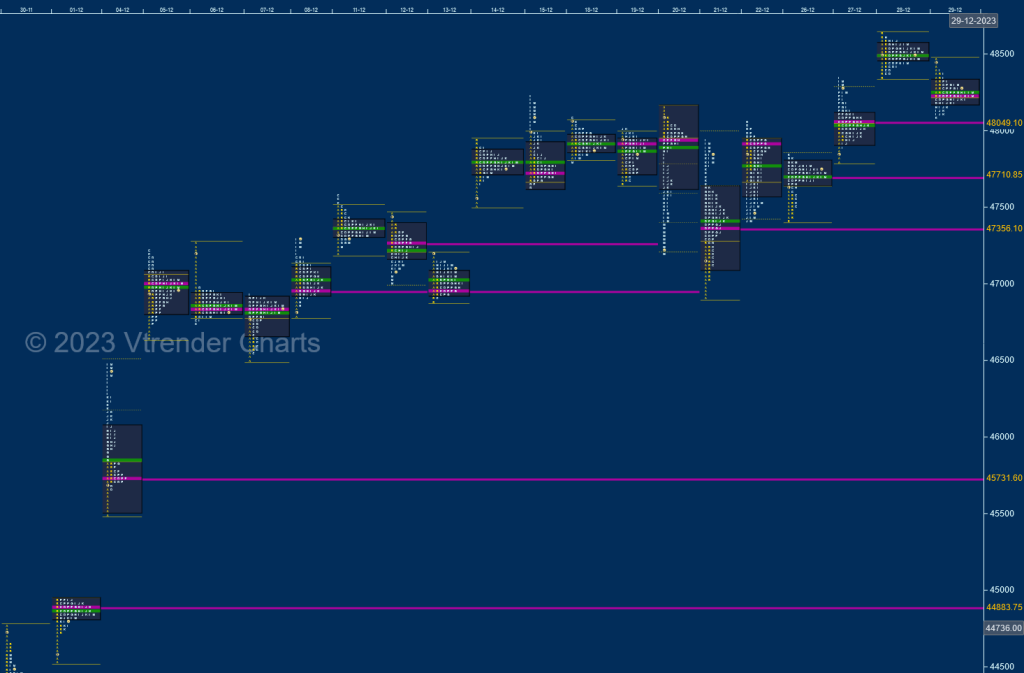
BankNifty Dec Spot: 48292 [ 48636 / 44531 ]
Previous month’s report ended with this ‘BankNifty also started the month leaving an inititative buying tail from 42796 to 42589 along with another zone of singles from 42815 to 43226 as it went on to make a trending move higher till mid November to 44421 getting rejected from October’s POC of 44364 which triggered a slightly deep retracement down to 43230 but the buyers from the first 3 days of the month came back strongly not only defending their zone but went on to make a look up above October’s high of 44710 but has left a small responsive selling tail from 44630 to 44764 signalling some profit booking. This Month’s Value & Range were mostly inside at 43224-43619-44946 with the profile nicely filling up the low volume zone of previous month and looks good to continue higher in the coming month as long as the series VWAP of 43837 is held‘

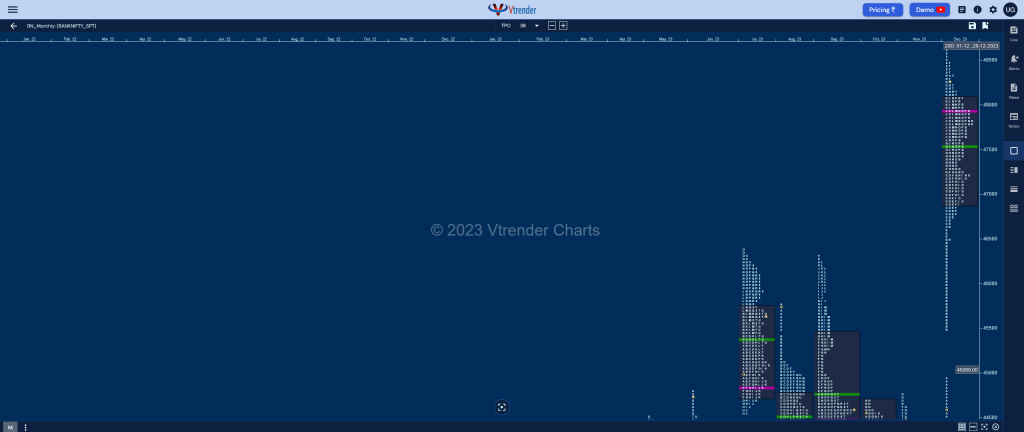
BankNifty formed a massive 4105 point range ‘p’ shape profile for the month with completely higher Value at 46876-47918-48091 with the bulk of the move coming in the first 4 sessions where it climbed by 2728 points taking out previous swing reference of 46310 and hitting new ATH of 47259 on 06th Dec leaving a long initiative buying tail on the higher timeframe from 46507 to 44531 along with couple of daily VPOCs at 45731 & 44883 (01st & 04th Dec respectively) after which it got into consolidation mode first forming a 7 day balance between 05th to 13th Dec building a prominent composite POC at 46831 which was followed by another higher balance from 14th to 26th Dec with the composite Value at 47646-47918-48072 including 3 daily VPOCs at 48049, 47710 & 47356 (27th, 26th & 21st Dec respectively). The auction made an attempt to move away from this Vaue on the upside on 28th but ended up forming the second most narrowest daily range of just 293 points for the month leaving a Gaussian Curve with a prominent POC at 48492 suggesting exhaustion before closing the month with ‘b’ shape long liquidation profile on 29th with completely lower Value and a prominent POC at 48237 making a low of 48092 taking support just above the 9-day Value mentioned above which would be the immediate zone to watch as we enter into January 2024.

Monthly Zones
- The settlement day Roll Over point (January 2024) is 48900
- The VWAP & POC of Dec 2023 Series is 47337 & 47918 respectively
- The VWAP & POC of Nov 2023 Series is 43837 & 43619 respectively
- The VWAP & POC of Oct 2023 Series is 43716 & 44346 respectively
- The VWAP & POC of Sep 2023 Series is 44438 & 44808 respectively
- The VWAP & POC of Aug 2023 Series is 44493 & 44550 respectively
- The VWAP & POC of Jul 2023 Series is 45414 & 45075 respectively
