Nifty Nov Spot: 20133 [ 20158 / 18973 ]
Previous month’s report ended with this ‘Value for the current month is at 19313-19537-19846 with the series VWAP closing at 19468 which matches with the higher SOC level of 19479 mentioned above and will serve as the Swing reference for the bulls to be back in November with the 4-month composite POC of 19542 being a minor hurdle on the upside for a rise back to 19792 levels‘
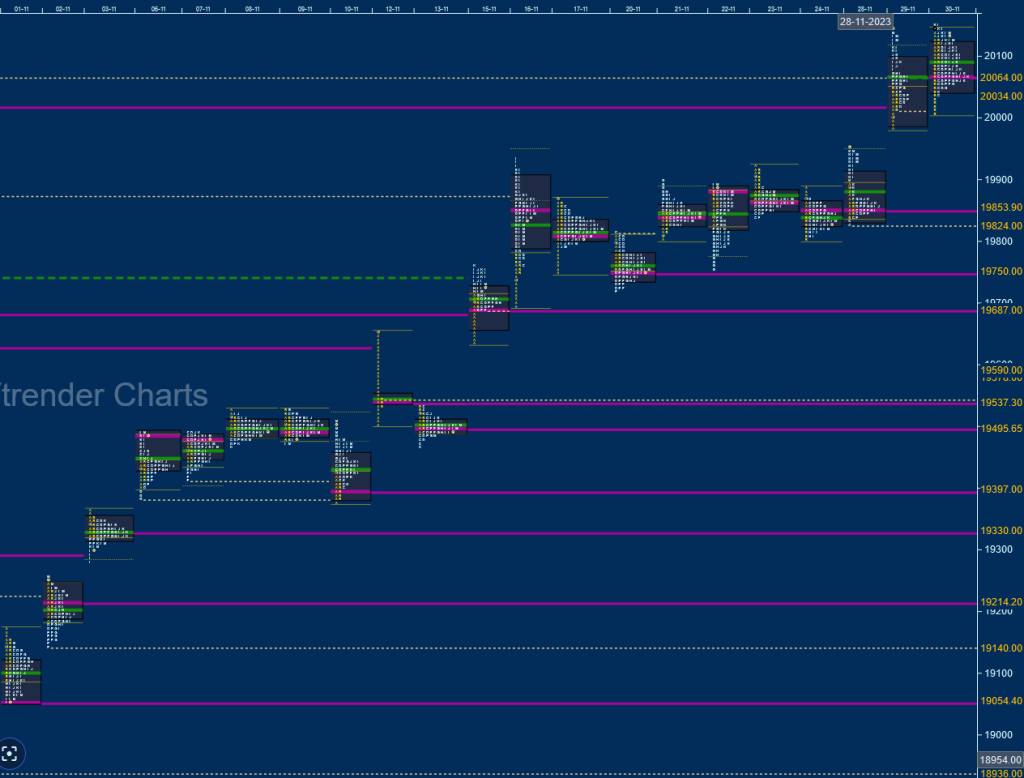
Week 1 [01-03 Nov] : 19230 (19276 / 18973)
Nifty opened the month with a new swing low at 18973 on 01st Nov and formed higher Value on the first 3 days leaving daily VPOCs at 19256 / 19124 & 19049 confirming a move away from the developing prominent weekly POC of 19125 with an initiative buying tail from 19210 to 19133 signalling the start of a new trend as it closed away from the weekly Value
Week 2 [06-10 Nov] : 19425 (19464 / 19309)
The auction continued the closing imbalance of the first week with a gap up open but got back into balance mode for the rest of the week as it remained in a narrow 155 point range forming a well balanced Value area zone from 19365 to 19456 with an ultra prominent POC at 19434 around where it closed
Week 3 [13-17 Nov] : 19731 (19875 / 19414)
The third week began with a test of previous month’s swing reference of 19468 & 19479 as it made a high of 19494 on 13th Nov but as expected saw some supply coming back as it left a small A period selling tail but made the dreaded C side extension to 19414 after which the sellers could not extend any further leaving a narrow range 3-1-3 profile for the day with a prominent POC at 19449 after which it made a big gap up open of over 200 points post the Diwali holiday on 14th confirming an initiative buying tail 19614 to 19579 and the sustaining above the 4-month composite POC of 19542 triggered a fresh upmove resulting in a Trend Day Up on 16th Nov where Nifty not only tagged 19792 but made a look up above previous month’s high while hitting 19875 and expectedly saw some profit booking leaving a Double Distribution Trend Up week
Week 4 [20-24 Nov] : 19794 (19875 / 19670)
The auction remained in the 16th Nov Trend Day profile range all week forming yet another narrow 205 points range balance building an ultra prominent TPO POC at 19800 and a Value area zone of mere 86 points from 19746 to 19830
Week 5 [27-30 Nov] : 20133 (20158 / 19800)
Nifty opened the final week confirming a FA (Failed Auction) right at 19800 on 28th Nov marking the start of yet another imbalance to the upside as it not only cleared the poor highs of last 2 weeks which was at 19875 but went on to complete the 2 ATR objective of 20008 with a gap up open on 29th and making higher highs of 20158 on the 30th leaving a Double Distribution Weekly profile with a close in imbalance
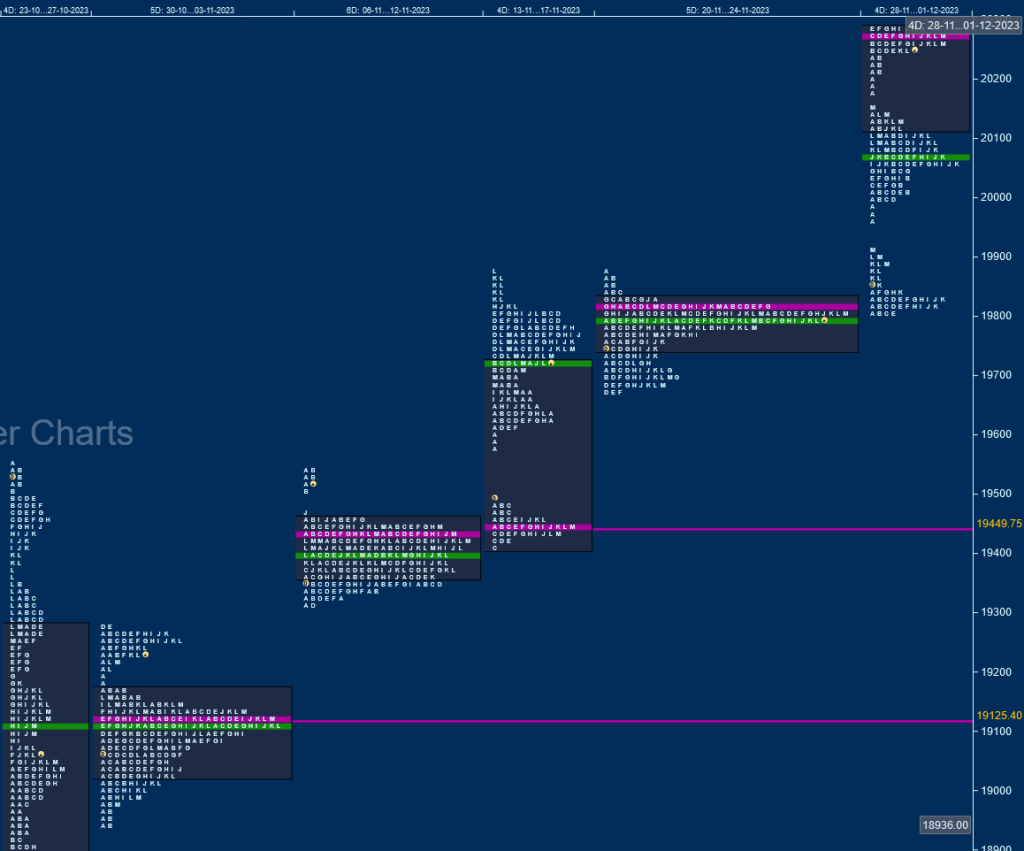
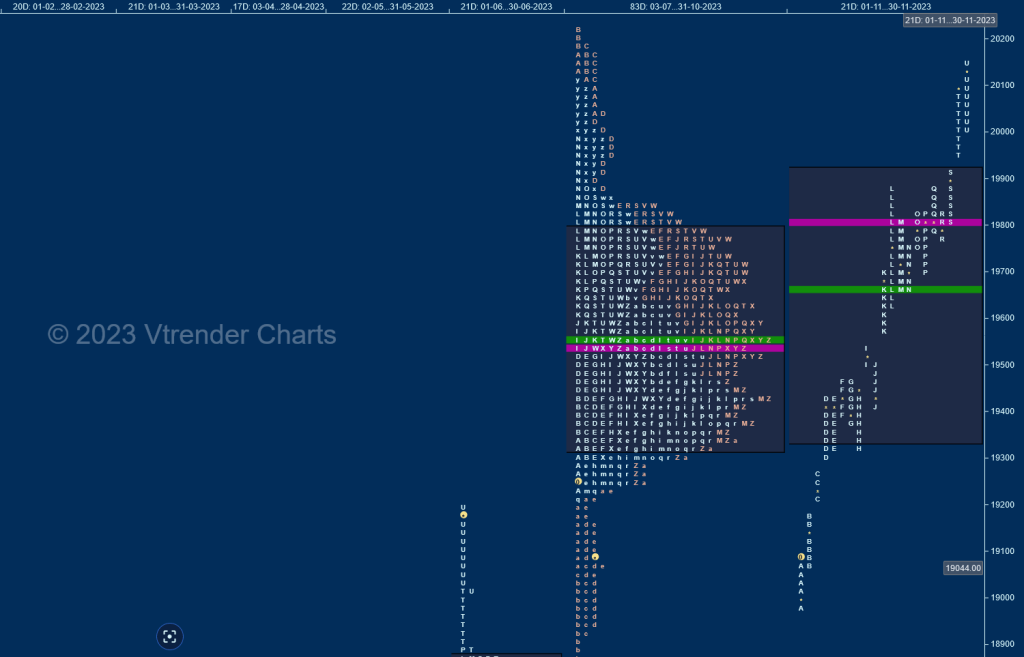
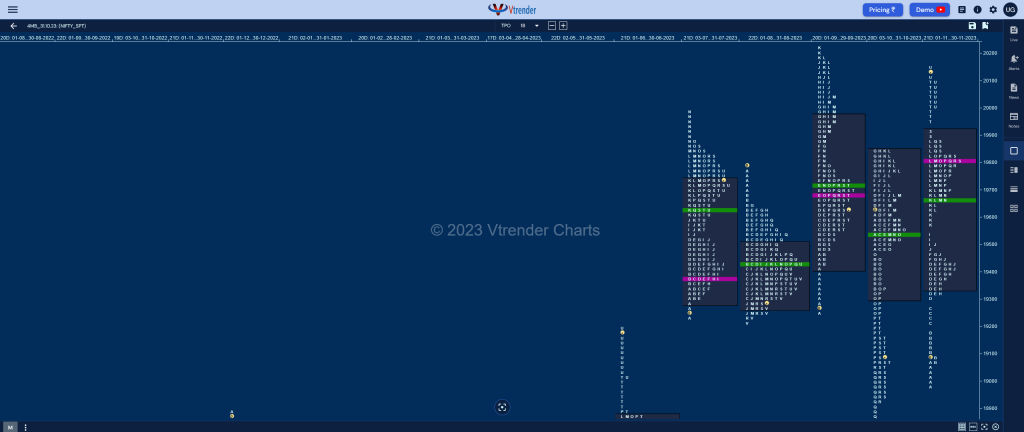
The Monthly Profile is a Trend Up one with an initiative buying tail from 19064 to 18973 along with 3 extension handles at 19096, 19175 & 19276 after which it went on to complete the 80% Rule in the 4-month composite Value of 19330-19542-19792 with the help of another extension handle at 19494 and a zone of singles till 19614 as it formed similar highs at 19875 in the third & fourth week. The final week however saw a fresh imbalance after the confirmation of a FA at 19800 leading to 3 more extension handles at 19875, 19916 & 20104 with Nifty closing around the highs of 20158 and in total contrast to previous month where it closed away from the 4-month Value on the downside but failed to give any follow through after testing that long term buy side extension handle of 18887 enabling the buyers to strike back as the formed a huge 1185 point range in November with a strong chance of the imbalance continuing although Value was once again overlapping at 19349-19806-19916 with the series VWAP being at 19652 and will be a swing reference not just for the next month but also for the year 2024.
Monthly Zones
- The settlement day Roll Over point (December 2023) is 20270
- The VWAP & POC of Nov 2023 Series is 19652 & 19806 respectively
- The VWAP & POC of Oct 2023 Series is 19468 & 19537 respectively
- The VWAP & POC of Sep 2023 Series is 19736 & 19672 respectively
- The VWAP & POC of Aug 2023 Series is 19440 & 19424 respectively
- The VWAP & POC of Jul 2023 Series is 19600 & 19430 respectively
- The VWAP & POC of Jun 2023 Series is 18739 & 18707 respectively
BankNifty Nov Spot: 44481 [ 44764 / 42589 ]
Previous month’s report ended with this ‘The Monthly profile was a Neutral Extreme one with the series VWAP at 43716 which will be the swing reference on the upside for the coming month with the immediate levels on the upside being the zone of singles between 43397 and the extension handle of 43558 whereas on the downside, this month’s responsive buying tail from 42482 to 42105 will serve as the support zone and a break of which can trigger a test of Apr’s series VWAP of 41930‘
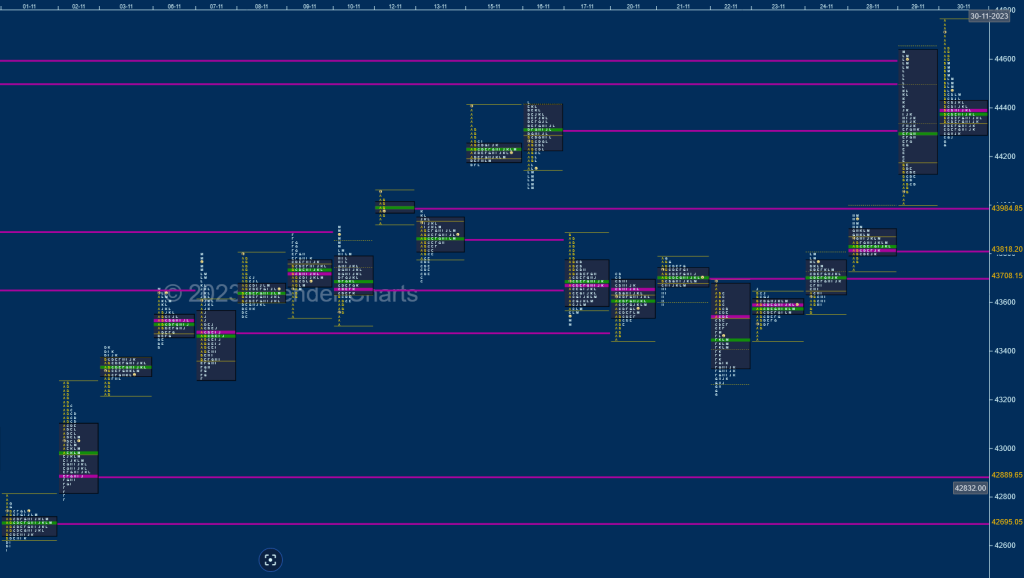
Week 1 [01-03 Nov] : 43318 (43416 / 42589)
BankNifty opened the month with a lower open and an attempt to extend further but could only manage to tag 42589 on 01st Nov forming a narrrow 226 point range Normal Day confirming a new daily swing low as it went on to probe higher for the rest of the week hitting 43416 stalling at October’s mid-profile zone of singles from 43397 to 43558 forming completely inside Value on the weekly from 42591 to 43093 but closed well away from the Value indicating that the PLR remains to the upside as it left couple of daily VPOCs at 42889 and 42695
Week 2 [06-10 Nov] : 43820 (43908 / 43283)
The auction opened with a gap up of more than 300 points scaling above the extension handle of 43558 and even made higher highs on 4 of the 5 days but all of them were marginal ones as the daily Value began to overlapping indicating the IPM (Initial Price Movement) getting into phase 2 resulting in an ideal Gaussian Curve on the weekly with Value at 43525-43655-43786 but once again closed above Value and well above October’s VWAP of 43716 indicating that sellers have lost control
Week 3 [13-17 Nov] : 43584 (44421 / 43513)
The third week displayed two way auction starting with a probe into previous Value which took support just above the prominent POC of 43655 after which it went on to hit a new monthly high of 44421 on 16th Nov but saw big liquidation into the close leaving a Neutral Extreme Day Down and the imbalance continued into the close of the week as it opened with a gap down of more than 500 points on 17th right at that POC of 43655 & made new lows of 43513 completing the 80% Rule in last week’s balance leaving a Double Distribution weekly profile with a zone of singles from 44164 to 43955 along with a prominent POC at 44229
Week 4 [20-24 Nov] : 43769 (43806 / 43231)
The auction remained below the DD zone filling up the lower distribution of previous week for the first 2 days after which it made a fresh move away to the downside on 22nd Nov where it made a low of 43230 taking support just above the buying tail from 43226 to 43017 from 03rd marking the return of demand and more confirmation came in form of a hat-trick of small but important initiative buying tails on the next 2 days resulting in new highs of 43806 and a narrow 576 point range balanced weekly profile with completely lower Value and a prominent POC at 43521-43590-43719
Week 5 [27-30 Nov] : 44481 (44764 / 43739)
BankNifty opened the final week with yet another small A period buying tail on 28th Nov from 43762 to 43739 which came right at previous VAH after which it probed higher tagging the weekly DD zone lower reference of 43955 while making a high of 43960 and went on to scale above the zone high of 44164 with the help of a gap up plus a Drive on th 29th where it formed a Trend Day Up hitting new highs for the month at 44630 and followed it another higher open on the last day of the month where it made a look up above October highs of 44710 while making a high of 44764 but saw huge profit booking coming in resulting in a ‘b’ shape long liquidation profile with a prominent POC at 44391 making a low of 44254 with the Trend Day’s mid-profile singles from 44248 to 44163 holding and the weekly structure representing a DD with completely higher Value and a prominent POC at 44342 but also has a selling tail at top from 44649 to 44764 for now as it gets into a new month
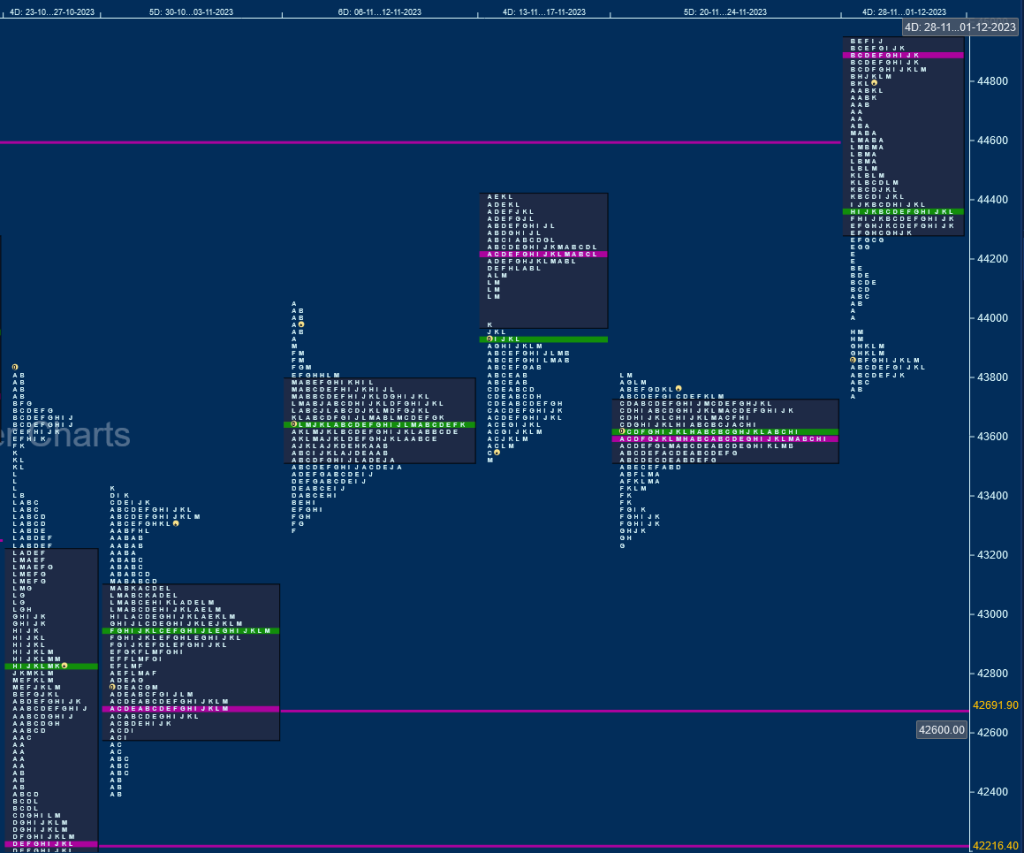
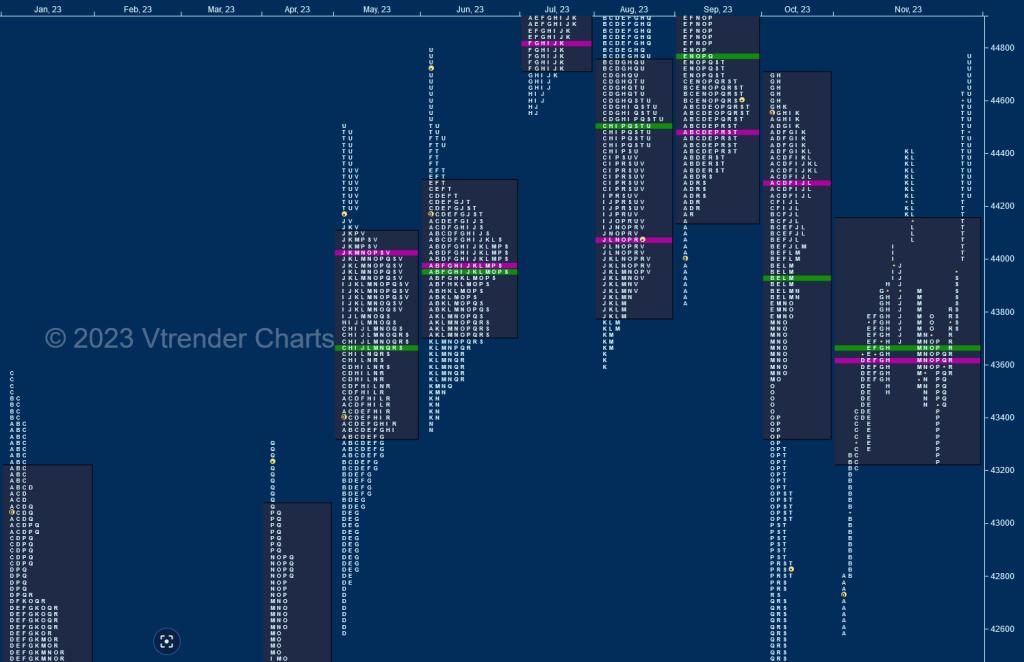
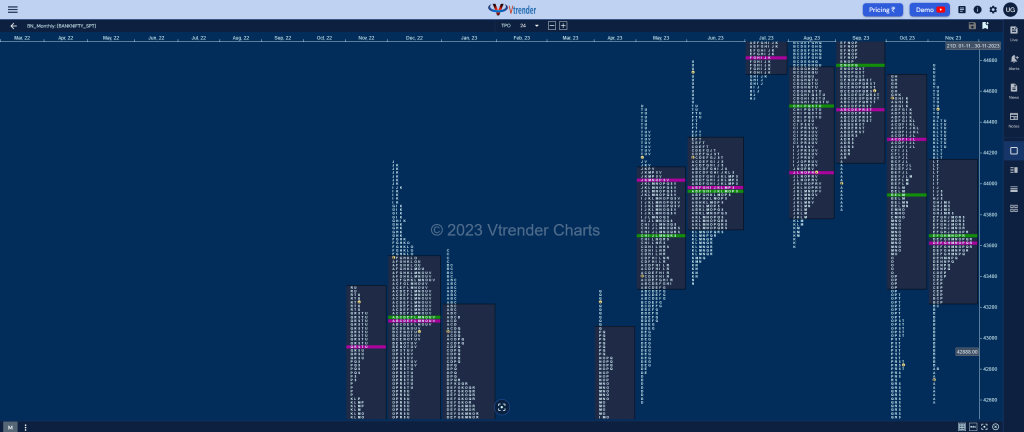
BankNifty also started the month leaving an inititative buying tail from 42796 to 42589 along with another zone of singles from 42815 to 43226 as it went on to make a trending move higher till mid November to 44421 getting rejected from October’s POC of 44364 which triggered a slightly deep retracement down to 43230 but the buyers from the first 3 days of the month came back strongly not only defending their zone but went on to make a look up above October’s high of 44710 but has left a small responsive selling tail from 44630 to 44764 signalling some profit booking. This Month’s Value & Range were mostly inside at 43224-43619-44946 with the profile nicely filling up the low volume zone of previous month and looks good to continue higher in the coming month as long as the series VWAP of 43837 is held
Monthly Zones
- The settlement day Roll Over point (December 2023) is 44720
- The VWAP & POC of Nov 2023 Series is 43837 & 43619 respectively
- The VWAP & POC of Oct 2023 Series is 43716 & 44346 respectively
- The VWAP & POC of Sep 2023 Series is 44438 & 44808 respectively
- The VWAP & POC of Aug 2023 Series is 44493 & 44550 respectively
- The VWAP & POC of Jul 2023 Series is 45414 & 45075 respectively
- The VWAP & POC of Jun 2023 Series is 43966 & 43986 respectively
