Nifty Oct Spot: 19079 [ 19849 / 18940 ]
Previous month’s report ended with this ‘The monthly profile is an elongated 967 point range one with overlapping to higher Value at 19421-19675-19973 and has a buying tail from 19432 to 19255 along with an extension handle at 19458 which will be the swing zone for the coming month with the first layer of support at 19491 whereas on the upside, we have a low volume zone from 19728 to 20129 which Nifty can fill up provided it sustains above the September monthly POC & VWAP of 19675 & 19727 respectively with the higher references being this month’s SOC of 20129 & the FA of 20195‘
Week 1
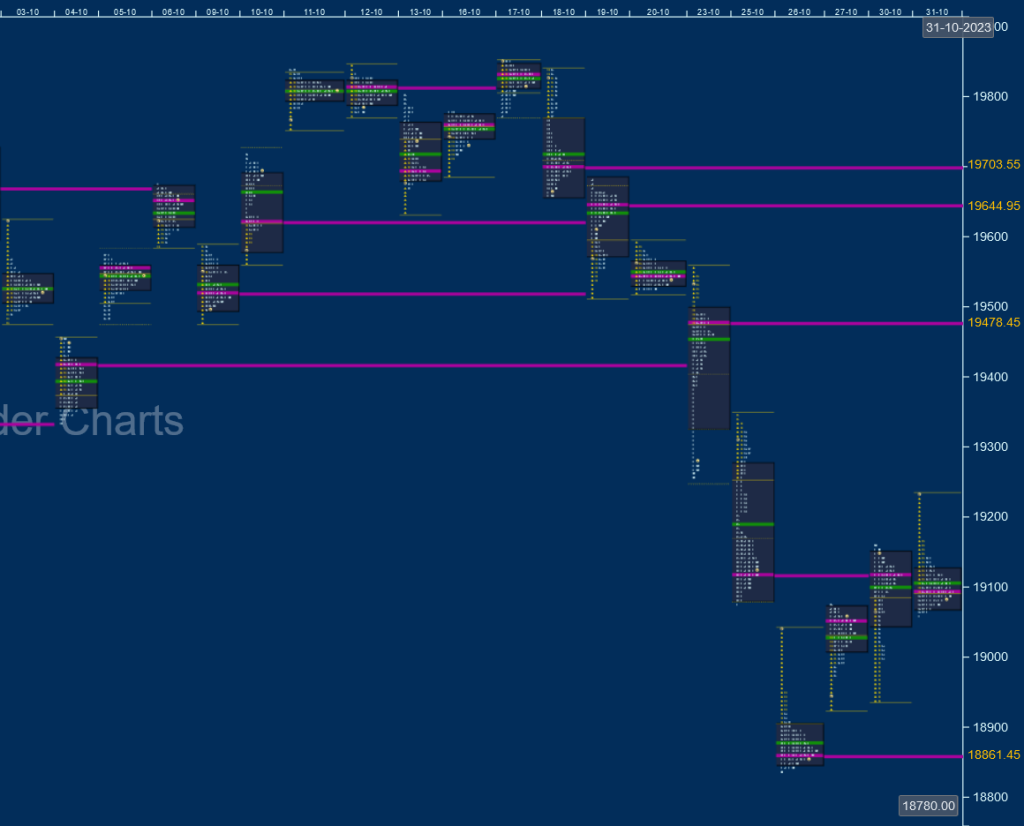
Nifty opened the month with a probe lower for the first 2 days as it got into September’s buying tail from 19432 to 19255 while making a low of 19333 on 04th Oct taking support at the weekly VPOC of 19335 (28 Aug – 01 Sep) after which it reversed the probe to the upside for the rest of the week leaving couple of daily VPOCs at 19420 & 19554 as it went on to make new highs of 19675 forming a Double Distribution profile on the weekly timeframe
Week 2
The auction opened the second week with a gap down breaking below 19554 & repairing 05th Oct’s poor lows of 19487 as it hit 19480 but left a small but important A period buying tail and made a trending move higher for the rest of the week to 19843 leaving an elongated weekly profile with completely higher Value but with a prominent POC right at the top at 19809 which indicated profit booking by the buyers
Week 3
The third week saw with an attempt to extend higher on the monthly timeframe on 17th Oct but ended up leaving poor highs at 19849 signalling exhaustion to the upside as it formed a nice Gaussian Curve with a prominent POC at 19831 and saw the sellers coming aggressively from 18th onwards starting with an extension handle at 19802 and a Double Distribution Day Down after which it formed lower value for the rest of the week making a low of 19512 leaving VPOCs at 19703 & 19644 and closing with a nice Gaussian Curve in a narrow range of just 75 points on 20th leaving an identical elongated profile on the weekly but this time to the downside with the POC shifting near the lows at 19542
Week 4
Nifty saw complete capitulation by the buyers in the fourth week of October which started with an extension handle on 23rd where it left a Trend Day Down closing in a spike down from 19404 to 19257 confirming a FA (Failed Auction) at 19849 on the monthly timeframe and continued this imbalance with a Triple Distribution Trend Day on 25th where it couple of fresh extension handles at 19257 & 19209 completely negating July’s buying tail while hitting a low of 19074 and followed it by a gap down plus drive open on 26th where it went on to tag the 30th Jun’s buying extension handle of 18886 and completed the monthly 1 ATR target of 18844 from 19849 while making a low of 18837 but ended up forming a ‘b’ shape profile for the day with the dPOC shifting down to 18861 indicating profit booking by the sellers and more confirmation of this came in form of a sharp bounce back to 19233 over the last 3 sessions of the month closing with another ‘b’ shape profile on the 31st with a prominent dPOC at 19096
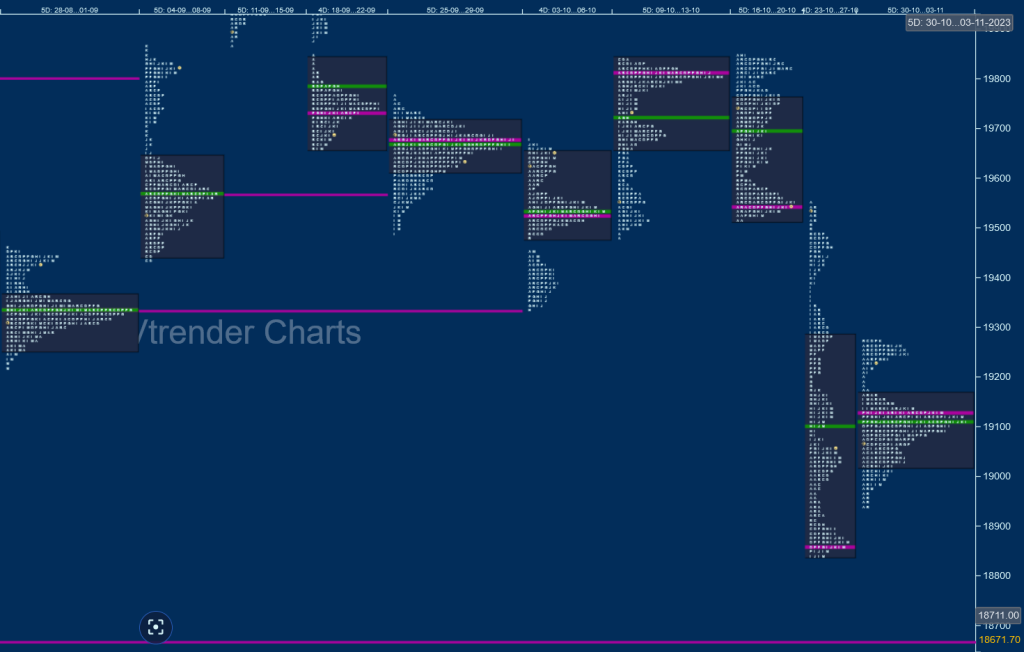
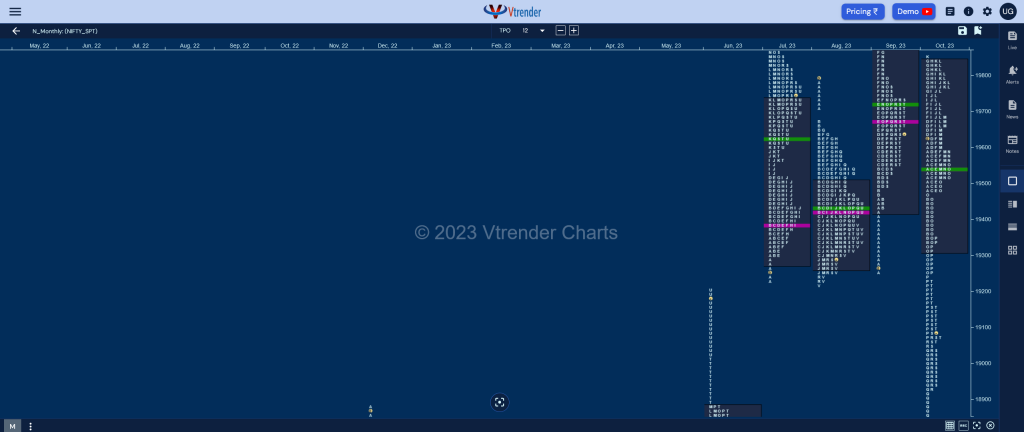
The Monthly Profile is a Neutral Extreme One to the downside with couple of SOCs (Scene Of Crime) levels at 19479 & 19333 with the help of which it has moved away from a larger timeframe 4-month balance Nifty had been forming since July 2023 and will be the important upside references for the coming month whereas on the downside, the longer term buying extension handle of 18886 which was tested and successfully defended for now as can be seen in form of a buying tail from 18926 to 18837 will be the zone to watch out for below which the auction could continue towards Jun’s monthly VPOC of 18707 & VAL of 18609 as immediate objectives along with May’s extension handle of 18459 & VPOC of 18270 as the extended targets. Value for the current month is at 19313-19537-19846 with the series VWAP closing at 19468 which matches with the higher SOC level of 19479 mentioned above and will serve as the Swing reference for the bulls to be back in November with the 4-month composite POC of 19542 being a minor hurdle on the upside for a rise back to 19792 levels.
Monthly Zones
- The settlement day Roll Over point (November 2023) is 18964
- The VWAP & POC of Oct 2023 Series is 19468 & 19537 respectively
- The VWAP & POC of Sep 2023 Series is 19736 & 19672 respectively
- The VWAP & POC of Aug 2023 Series is 19440 & 19424 respectively
- The VWAP & POC of Jul 2023 Series is 19600 & 19430 respectively
- The VWAP & POC of Jun 2023 Series is 18739 & 18707 respectively
- The VWAP & POC of May 2023 Series is 18232 & 18270 respectively
BankNifty Oct Spot: 42846 [ 44710 / 42105 ]
Previous month’s report ended with this ‘The Monthly profile as was expected for September is an elongated one with a range of 2480 points with an initiative buying tail from 44207 to 43830 which had almost completed the 3 IB objective of 46345 as it stalled at the swing reference of 46310 and left a SOC (Scene Of Crime) at 46028 marking the reversal of the probe to the downside and went on to drop back to 44182 leaving overlapping to higher Value at 44152-44470-45438 with the 2 FAs of 44182 & 44756 being the immediate references on either side as we start the new month of October‘
Week 1
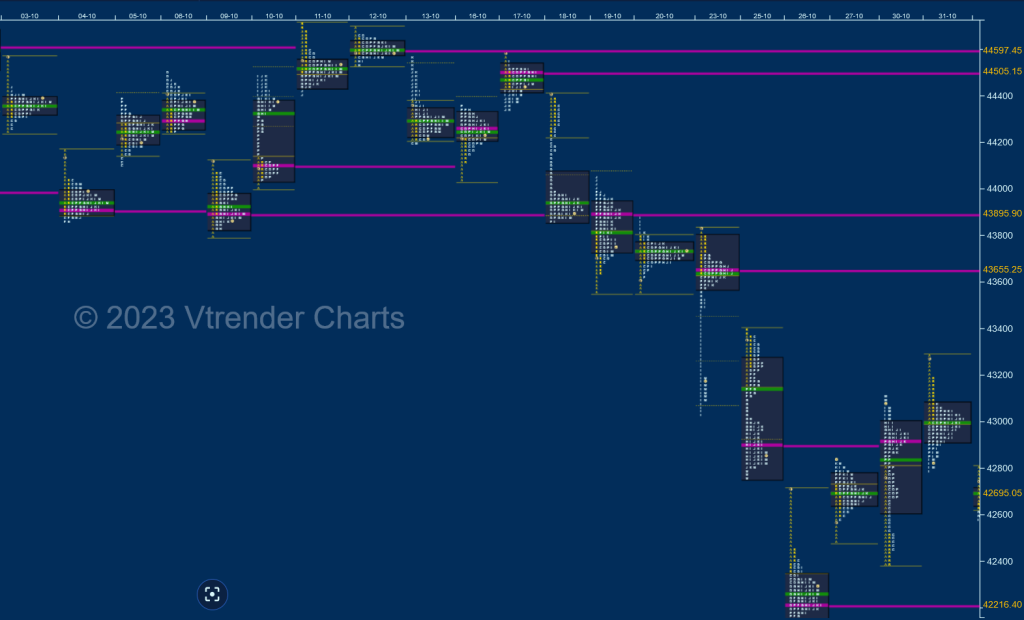
BankNifty opened the month with an A period selling tail from 44435 to 44566 on 03rd Oct and continued to probe lower for the first 2 sessions negating the lower FA of 44182 and almost tagging previous month’s low of 43830 while making a low of 43857 on 04th Oct but seemed like inventory had gotten too short as it left back to back ‘b’ shape profiles on the daily timeframe which triggered a short covering move back to 44500 as the first week gave a Double Distribution type of profile with a nice balance at the top with a close right at the prominent weeky POC of 44364
Week 2
The second week opened with a gap down with the auction making a look down below September lows as it hit 43796 but could not sustain indicating lack of fresh supply as it formed a Normal Day with the POC at 43890 on 09th leading to yet another short covering move higher as it went on to negate the 03rd Oct A period singles making new highs for the month at 44710 but formed a 2-day balance with similar highs marking the end of the upside as it closed the week with yet another DD profile with overlapping Value but with a higher prominent weekly POC at 44597
Week 3
Week 3 started with the continuation of the balance on the first day but then left an important signal by means of an initiative selling tail from 44544 to 44589 on 17th Oct that it wants to move away from previous week’s POC of 44597 and more confirmation of this came through a Double Distribution Trend Day Down on 18th where BankNifty left a selling extension handle just above previous month’s VAL of 44152 displaying that it now wants to probe lower which it did for the rest of the week while making similar lows of 44558 & 44567 forming a Trend Down week with mostly lower Value and the weekly POC shifting lower to 43733
Week 4
The auction started the fourth week with a balance around 43733 for most part of the day on 23rd Oct while building volumes slightly lower at 43655 but left a late extension handle at 43583 marking entry of fresh aggressive selling leading to a drop of over 500 points as it made a low of 43029 and continued this downmove after a brief balance on the 25th where it left another extension handle at 43114 forming yet another DD down while making new lows for the month at 42758 and this imbalance continued on 26th Oct with a Drive Down and an One Time Frame probe lower till the E period where it tagged the April 2023 monthly VPOC of 42193 while making a low of 42105 and saw profit booking by the sellers as it formed a ‘b’ shape profile with the dPOC down at 42216
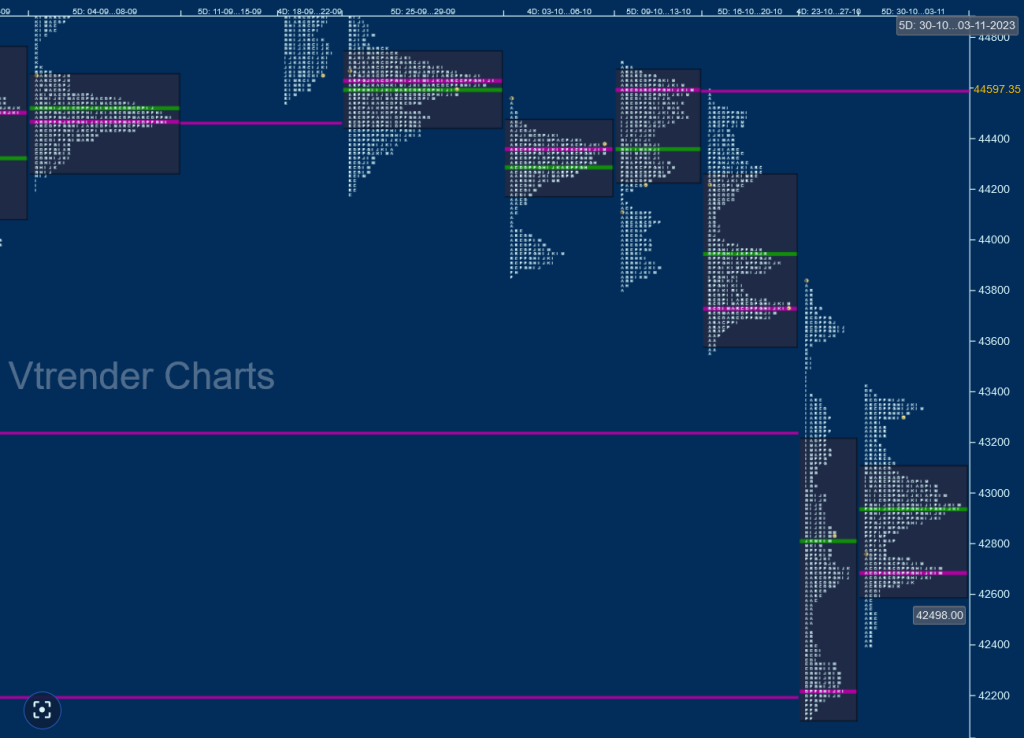
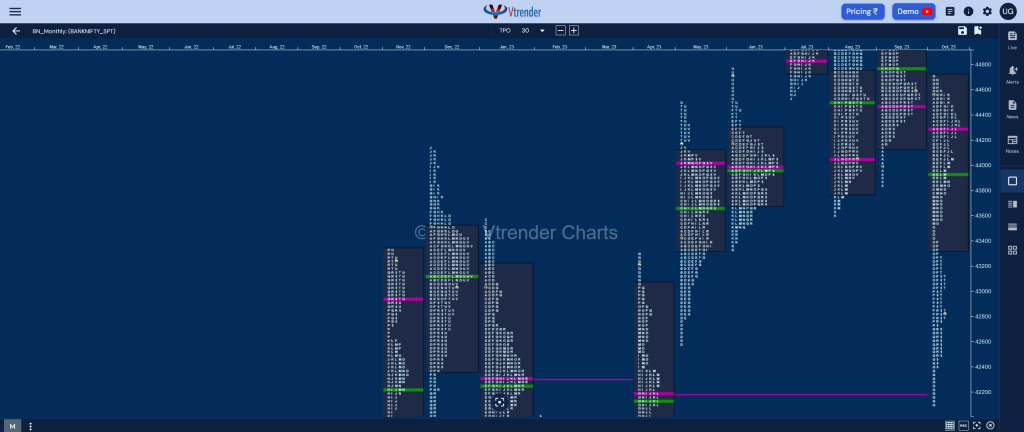
Similar to Nifty, we saw a bounce back over the last 3 days to 43356 as BankNifty remained above 42216 marking the end of the downside and start of a fresh balance leaving a Neutral Extreme profile on the monthly timeframe with overlapping to lower Value at 43325-44346-44702 with the series VWAP at 43716 which will be the swing reference on the upside for the coming month with the immediate levels on the upside being the zone of singles between 43397 and the extension handle of 43558 whereas on the downside, this month’s responsive buying tail from 42482 to 42105 will serve as the support zone and a break of which can trigger a test of Apr’s series VWAP of 41930 along with the buy side singles from 41799 to 41610 below which we have the extension handles of 41403 & 41274 as extended objectives.
Monthly Zones
- The settlement day Roll Over point (November 2023) is 42564
- The VWAP & POC of Oct 2023 Series is 43716 & 44346 respectively
- The VWAP & POC of Sep 2023 Series is 44438 & 44808 respectively
- The VWAP & POC of Aug 2023 Series is 44493 & 44550 respectively
- The VWAP & POC of Jul 2023 Series is 45414 & 45075 respectively
- The VWAP & POC of Jun 2023 Series is 43966 & 43986 respectively
- The VWAP & POC of May 2023 Series is 43660 & 43700 respectively
