Nifty Oct F: 19850 [ 19874 / 19780 ]

| Open Type |
|---|
| OAOR (Open Auction Out of Range) |
| Volumes of 14,770 contracts |
| Initial Balance |
|---|
| 86 points (19866 – 19780) |
| Volumes of 36,636 contracts |
| Day Type |
|---|
| Normal (p shape) – 95 points |
| Volumes of 94,632 contracts |
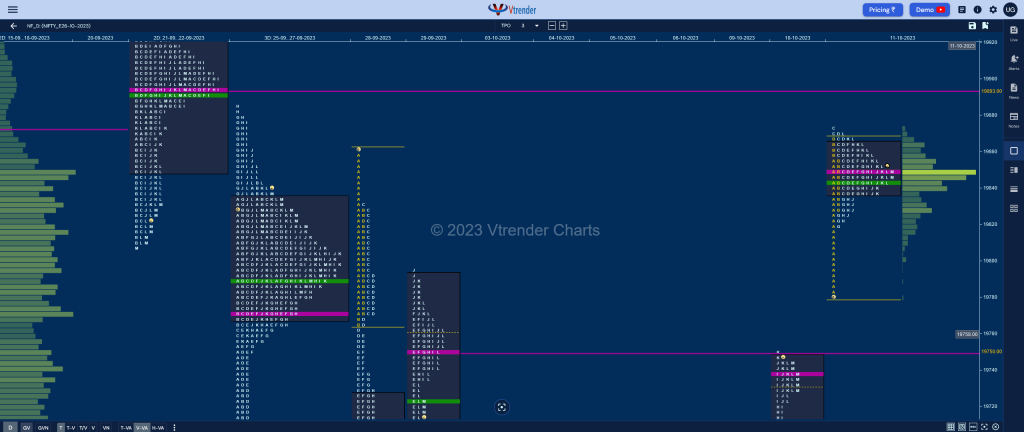
NF opened above the 29th Sep VPOC of 19750 and made an OL (Open=Low) start at 19780 giving a drive like move to the upside as it went on scale above 28th Sep’s selling tail from 19833 along with that day’s swing high of 19860 while hitting 19866 in the B period.
The auction then made a typical C side extension to 19874 which marked the end of the upside for the day as it failed to get fresh demand and gave the customary retracement to day’s VWAP even breaking below it in the G TPO but took support in the morning A period singles leaving a PBL at 19820 after which it remained in a narrow range forming a ‘p’ shape Normal Day with completely higher Value and a close around the prominent POC of 19848 which will be the reference for the next open.
Click here to view the latest profile in NF on Vtrender Charts
Daily Zones
- Largest volume (POC) was traded at 19848 F and VWAP of the session was at 19843
- Value zones (volume profile) are at 19836-19848-19864
- HVNs are at 19569** / 19750 (** denotes series POC)
Monthly Zones
- The settlement day Roll Over point (October 2023) is 19635
- The VWAP & POC of Sep 2023 Series is 19736 & 19672 respectively
- The VWAP & POC of Aug 2023 Series is 19440 & 19424 respectively
- The VWAP & POC of Jul 2023 Series is 19600 & 19430 respectively
Business Areas for 12th Oct 2023
| Up |
| 19869 – Tail from 11 Oct 19893 – 2-day VPOC (21-22 Sep) 19943 – 2-day VAH (21-22 Sep) 19986 – 1 ATR (yPOC 19848) 20013 – 2 ATR (VPOC 19739) 20039 – Tail Top (29 Sep) |
| Down |
| 19848 – dPOC (11 Oct) 19820 – Buying Tail (11 Oct) 19779 – Singles mid (11 Oct) 19739 – VPOC from 10 Oct 19686 – DD VWAP (10 Oct) 19651 – HVN from 10 Oct |
BankNifty Oct F: 44685 [ 44808 / 44550 ]

| Open Type |
|---|
| OAOR (Open Auction Out of Range) |
| Volumes of 17,441 contracts |
| Initial Balance |
|---|
| 193 points (44808 – 44615) |
| Volumes of 47,870 contracts |
| Day Type |
|---|
| Normal (‘b‘ shape) – 258 points |
| Volumes of 1,40,801 contracts |
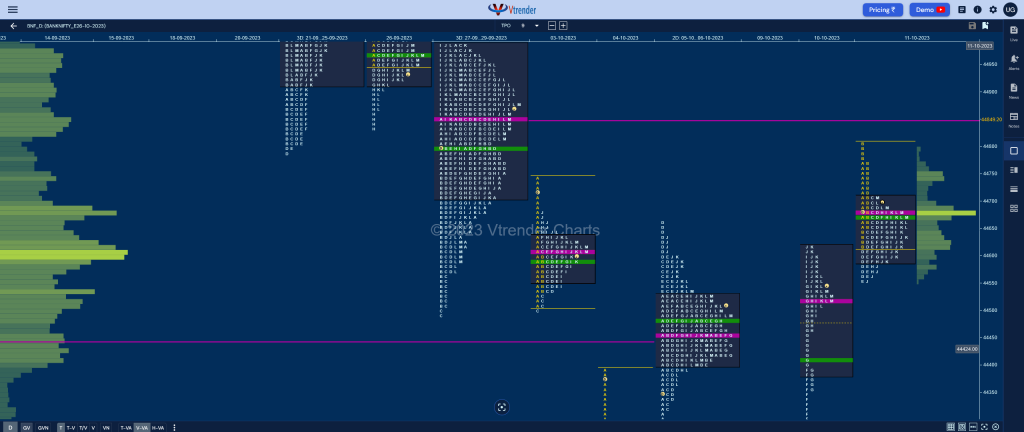
BNF made a gap up open of 153 points negating 03rd Oct’s selling tail as well as Swing High of 44664 as it went on to complete an important objective of 44750 in the A period while making a high of 44474 and made new highs of 44808 as the B TPO began but was swiftly rejected from just below 29th Sep’s VAL resulting in new lows for the day at 44615 at the close of the IB (Initial Balance)
The auction then remained below VWAP for most part of the day and even made few attempts to extend lower but could only manage similar lows in the 44565 to 44550 zone forming a ‘b’ shape profile for the day with a close around the prominent POC of 44680 with overlapping to higher Value being formed.
Click here to view the latest profile in BNF on Vtrender Charts
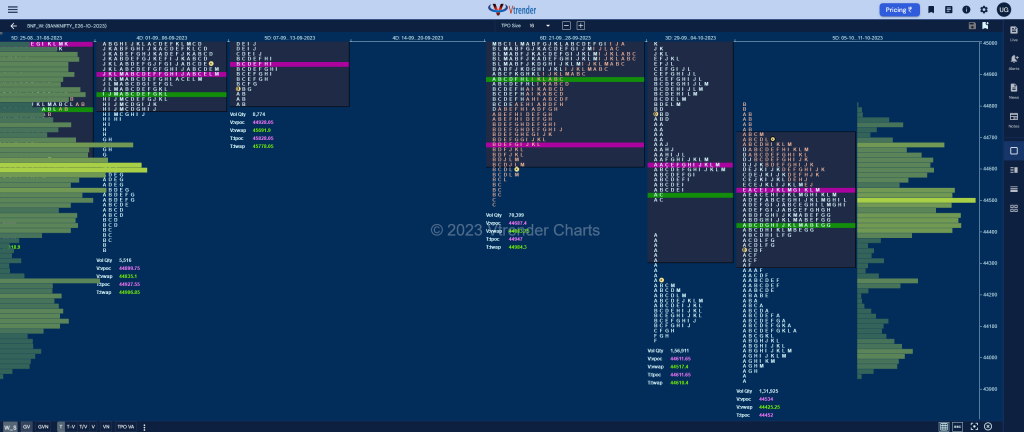
Weekly Settlement (05th to 11th Oct) : 44685 [ 44808 / 43935 ]

BNF has formed a Neutral Extreme profile to the upside after making a look down below last week’s low and forming a HVN at 44029 after which it probed higher for the rest of the week filling up the low volume zone between the HVN of 44164 & 44849 from previous profile with a nice balanced Value area for the current week at 44299-44534-44707 with this week’s VWAP of 44425 being the important reference now on the downside.
Daily Zones
- Largest volume (POC) was traded at 44680 F and VWAP of the session was at 44667
- Value zones (volume profile) are at 44586-44680-44706
- HVNs are at 44413 / 44535 / 44611** / 44849 (** denotes series POC)
Monthly Zones
- The settlement day Roll Over point (October 2023) is 44595
- The VWAP & POC of Sep 2023 Series is 44808 & 44438 respectively
- The VWAP & POC of Aug 2023 Series is 44493 & 44550 respectively
- The VWAP & POC of Jul 2023 Series is 45414 & 45075 respectively
Business Areas for 12th Oct 2023
| Up |
| 44680 – dPOC from 11 Oct 44774 – Selling Tail (11 Oct) 44849 – 2-day VPOC (28-29 Sep) 44998 – Swing High (28 Sep) 45091 – 3-day POC (21-25 Sep) 45198 – 3-day HVN (21-25 Sep) |
| Down |
| 44630 – K TPO POC (11 Oct) 44516 – VPOC from 10 Oct 44412 – DD VWAP (10 Oct) 44317 – Mid-profile singles (10 Oct) 44201 – Buying Tail (10 Oct) 44105 – Singles mid (10 Oct) |
You can check the monthly charts & other swing levels for both Nifty & BankNifty here & for the weekly charts & analysis, please click here.
