Nifty Mar F: 22103 [ 22515 / 22025 ]

| Open Type |
|---|
| OAIR (Open Auction In Range) |
| Volumes of 12,725 contracts |
| Initial Balance |
|---|
| 144 points (22515 – 22371) |
| Volumes of 38,028 contracts |
| Day Type |
|---|
| Trend – 490 pts |
| Volumes of 2,29,024 contracts |
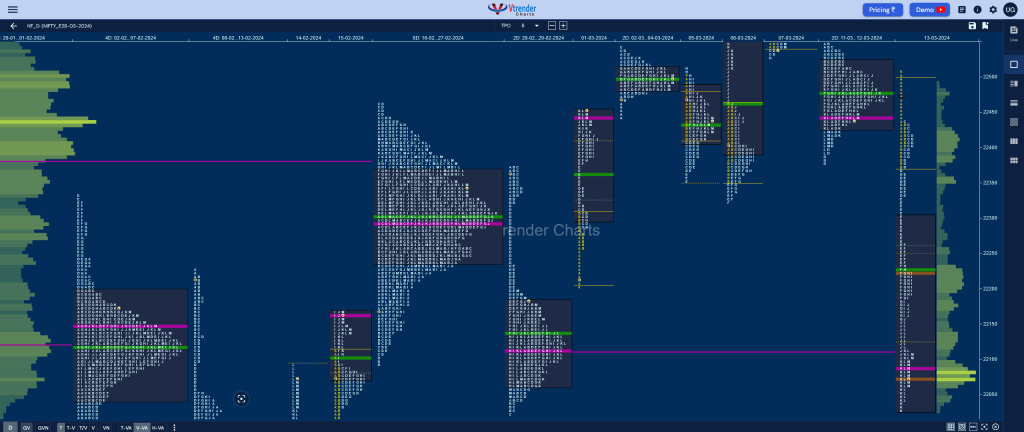
NF opened around the VAH of the 2-day composite but could not get above it and left an A period selling tail marking the start of a fresh imbalance to the downside as it made a look down below PDL to hit 22371 in the IB and got further confirmation when the C side left a PBH at 22438 stalling just below the composite POC of 22442 which was followed by a RE in the D to 22333.
The auction then saw sellers completely dominating as they made a big RE in the E TPO getting into the 01st Mar buying tail and completely negated it by making lower lows in the F & G where it made a low of 22185 tagging the Roll Over point of this series from where it gave a small bounce to 22232 in the H period leaving another PBH there and went on to resume the downside expansion with fresh REs in the J & K not only completing the 3 IB target of 22084 but going on to make a low of 22025.
NF took support just above 29th Feb’s FA of 22022 and saw some profit booking by the sellers along with a bit of short covering which led to a bounce in the L TPO back to 22153 before coming back to 22062 into the close leaving an elongated Trend Day Down of 490 points with the POC at 22085 & the VWAP at 22226 which will be the new swing reference for the series going forward.
Click here to view the latest profile in NF on Vtrender Charts
Daily Zones
- Largest volume (POC) was traded at 22085 F and VWAP of the session was at 22226
- Value zones (volume profile) are at 22025-22085-22301
- NF confirmed a FA at 22022 on 29/02 and completed the 2 ATR objective of 22456
- HVNs are at 22393 / 22443** / 22497 / 22596 (** denotes series POC)
Weekly Zones
- Weekly Charts can be viewed here
- (01-07 Mar) – NF opened the week with an initiative probe to the upside right from the Mar RO point of 22188 as it left a buying tail from 22259 to 22180 and went on to record similar highs of 22547 & 22545 triggering a round of profit booking as it made a retracement down to 22322 taking support just above previous week’s VAH of 22293 and saw demand coming back resulting in a fresh imbalance and new ATH of 22620 but lack of fresh buying led to another round of profit booking as the auction came down to 22526 before closing the week at 22552 leaving a Normal Variation profile with completely higher Value at 22335-22443-22551 with the VWAP at 22452.
Monthly Zones
- The settlement day Roll Over point (March 2024) is 22188
- The VWAP & POC of Feb 2024 Series is 21956 & 21930 respectively
- The VWAP & POC of Jan 2024 Series is 21581 & 21635 respectively
- The VWAP & POC of Dec 2023 Series is 21226 & 21377 respectively
Business Areas for 14th Mar 2024
| Up |
| 22108 – M TPO high 22155 – Ext Handle (13 Mar) 22187 – I TPO VWAP 22226 – TD VWAP (13 Mar) 22260 – Mid-profile tail |
| Down |
| 22071 – Closing HVN 22022 – FA (29 Feb) 21983 – K TPO VWAP (14 Feb) 21936 – Ext Handle (14 Feb) 21900 – Weekly VPOC |
BankNifty Mar F: 47081 [ 47684 / 46947 ]

| Open Type |
|---|
| OAIR (Open Auction In Range) |
| Volumes of 10,162 contracts |
| Initial Balance |
|---|
| 237 points (47661 – 47425) |
| Volumes of 40,743 contracts |
| Day Type |
|---|
| Neutral Extreme – 737 points |
| Volumes of 2,06,594 contracts |
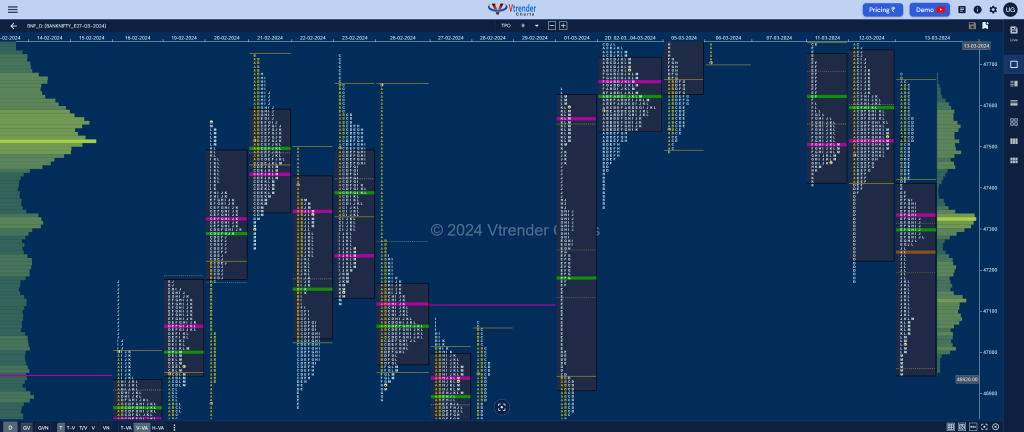
BNF made a sedate start and remained in previous value as there were no initiative volumes as it formed a narrow IB range of 237 points after which it made the dreaded C side extension to 47684 which was swiftly rejected leading to a RE lower in the D period confirming a FA at top.
BNF made a sedate start and remained in previous value as there were no initiative volumes as it formed a narrow IB range of 237 points after which it made the dreaded C side extension to 47684 which was swiftly rejected leading to a RE lower in the D period confirming a FA at top.
BNF then made a fresh RE in the J TPO followed by lower lows in the K where it completed the 1 ATR objective of 47063 while hitting 47043 and saw a good short covering bounce back to 47277 in the L before concluding the Neutral Extreme set up for the day by making new lows of 46947 in the M period which also marked the realisation of the 3 IB target of 46951.
Click here to view the latest profile in BNF on Vtrender Charts
Daily Zones
- Largest volume (POC) was traded at 47335 F and VWAP of the session was at 47298
- Value zones (volume profile) are at 46952-47335-47408
- BNF confirmed a FA at 47684 on 13/03 and tagged the 1 ATR objective of 47063 on the same day. The 2 ATR target comes to 46442
- HVNs are at 47521** / 48217 (** denotes series POC)
Weekly Zones
- Weekly Charts can be viewed here
- (07-14 Mar) – BNF has formed an inside bar on the weekly with overlapping to lower value at 47000-47518-47593 and is a Trend Down one which has moved away to the downside from the prominent POC of 47518 so this week’s VWAP of 47600 will now be the swing reference for the coming week
- (01-06 Mar) – BNF left a Trend Up weekly profile hitting the 2 IB target of 48343 forming completely higher value at 47444-47567-48229 with a closing HVN at 48217 which will be the immediate reference on the upside in the coming week staying above which it could go for the higher VPOC of 48480 and HVN of 48864 from the weekly profile of 11th to 17th Jan whereas on the downside, this week’s VWAP of 47694 will be an important swing support.
Monthly Zones
- The settlement day Roll Over point (March 2024) is 46610
- The VWAP & POC of Feb 2024 Series is 46119 & 45700 respectively
- The VWAP & POC of Jan 2024 Series is 46353 & 48119 respectively
- The VWAP & POC of Dec 2023 Series is 47337 & 47918 respectively
Business Areas for 14th Mar 2024
| Up |
| 47083 – M TPO high 47165 – L TPO POC 47298 – NeuX VWAP (13 Mar) 47425 – IBL (13 Mar) 47539 – SOC (13 Mar) |
| Down |
| 47013 – M TPO POC 46888 – HVN (01-Mar) 46780 – A TPO h/b (01 Mar) 46649 – Closing tail (29-Feb) 46504 – HVN (29-Feb) |
You can check the monthly charts & other swing levels for both Nifty & BankNifty here & for the weekly charts & analysis, please click here.
