Nifty Oct F: 19740 [ 19794 / 19693 ]

| Open Type |
|---|
| OAIR (Open Auction In Range) |
| Volumes of 8,904 contracts |
| Initial Balance |
|---|
| 57 points (19749 – 19693) |
| Volumes of 19,619 contracts |
| Day Type |
|---|
| Normal Variation – 101 points |
| Volumes of 75,101 contracts |
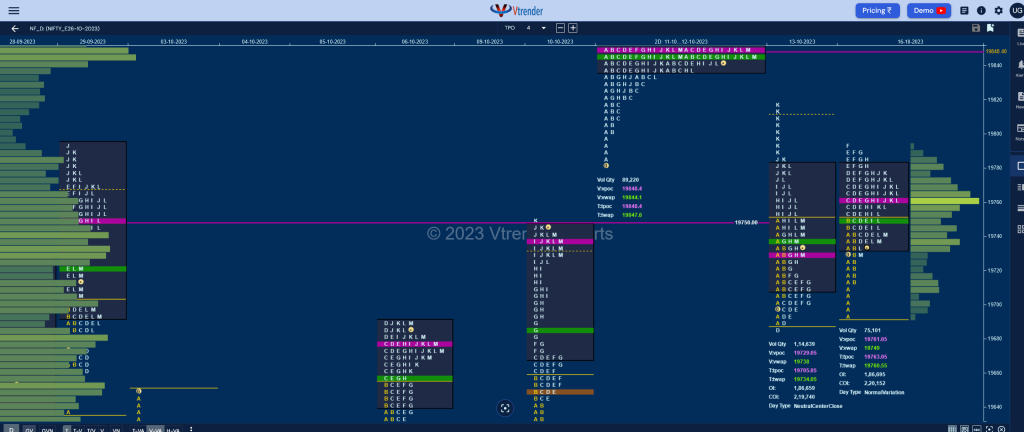
NF made an OAIR start making a look down below previous Value making a low of 19693 in the A period as it took support just above the FA of 19685 and once it got above yVWAP of 19738 started a slow OTF (One Time Frame) probe higher till the F TPO where it made a high of 19794 stalling exactly at the monthly IBH level and just below the RS POC from Friday’s H period’s POC of 19798.
Unable to take out previous profile’s selling tail, the auction then made a retracment back to day’s VWAP into the close even breaking below it in the L & M TPOs as it made a low of 19730 leaving a ‘p’ shape profile with both range & value completely inside that of Friday’s giving a nice 2-day balance with a FA at 19685 on the downside & a selling tail from 19794 to 19843 on the upside so will need initiative volumes at one of these references for a fresh move in that direction.
Click here to view the 2-day #MarketProfile composite only on Vtrender Charts
Click here to view the latest profile in NF on Vtrender Charts
Daily Zones
- Largest volume (POC) was traded at 19749 F and VWAP of the session was at 19761
- Value zones (volume profile) are at 19733-19761-19781
- HVNs are at 19569 / 19750 / 19848** (** denotes series POC)
- NF confirmed a FA at 19685 on 13/10 and almost tagged the 1 ATR objective of 19818 on the same day. The 2 ATR target comes to 19950
Monthly Zones
- The settlement day Roll Over point (October 2023) is 19635
- The VWAP & POC of Sep 2023 Series is 19736 & 19672 respectively
- The VWAP & POC of Aug 2023 Series is 19440 & 19424 respectively
- The VWAP & POC of Jul 2023 Series is 19600 & 19430 respectively
Business Areas for 17th Oct 2023
| Up |
| 19749 – VWAP from 16 Oct 19788 – Selling tail (16 Oct) 19818 – 1 ATR (FA of 19685) 19848 – 2-day VPOC (11-12 Oct) 19893 – 2-day VPOC (21-22 Sep) 19943 – 2-day VAH (21-22 Sep) |
| Down |
| 19730 – Closing PBL (16 Oct) 19685 – FA from 13 Oct 19646 – PBL from 10 Oct 19611 – IB singles mid (10 Oct) 19584 – Singles mid (10 Oct) 19550 – VPOC from 09 Oct |
BankNifty Oct F: 44343 [ 44455 / 44150 ]

| Open Type |
|---|
| OAOR (Open Auction Out of Range) |
| Volumes of 5,804 contracts |
| Initial Balance |
|---|
| 186 points (44455 – 44150) |
| Volumes of 33,952 contracts |
| Day Type |
|---|
| Normal Variation (NV) – 305 points |
| Volumes of 96,309 contracts |
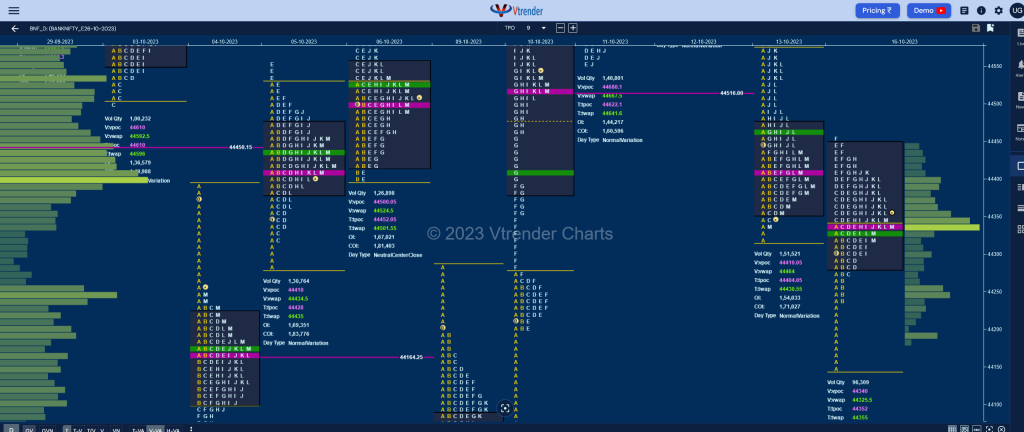
BNF not only opened lower but continued to probe further down testing the A period buying tail of 10th Oct from 44201 to 44080 as it made a low of 44150 and saw some demand coming back as could be seen in the RB POC it left at 44191 in the A period and followed it up with a C side extension to 44383 which gave a retracement down to day’s VWAP which was defended indicating morning buyers being in control.
The auction then made a fresh RE (Range Extension) to the upside in the D TPO & followed it with marginal highs of 44449 & 44455 in the E & F signalling exhaustion just below Friday’s VWAP & the L TPO POC of 44460 forcing some of the longs to liquidate triggering a small retracement down to 44305 in the I period where it left a PBL.
The closing 4 TPOs (J to M) formed a narrow range balance between 44305 & yPOC of 44410 leaving a ‘p’ shape profile for the day with mostly overlapping Value hence the 2-day composite leaves us with a nice balance at 44322-44405-44497 and is likely to give a move away from this zone in the coming session(s) provided it is backed with better than average volumes. Click here to view the 2-day #MarketProfile composite only on Vtrender Charts
Click here to view the latest profile in BNF on Vtrender Charts
Daily Zones
- Largest volume (POC) was traded at 44340 F and VWAP of the session was at 44325
- Value zones (volume profile) are at 44286-44340-44444
- HVNs are at 44413** / 44535 / 44611 / 44849 (** denotes series POC)
Monthly Zones
- The settlement day Roll Over point (October 2023) is 44595
- The VWAP & POC of Sep 2023 Series is 44808 & 44438 respectively
- The VWAP & POC of Aug 2023 Series is 44493 & 44550 respectively
- The VWAP & POC of Jul 2023 Series is 45414 & 45075 respectively
Business Areas for 17th Oct 2023
| Up |
| 44340 – dPOC from 16 Oct 44449 – Selling tail (16 Oct) 44564 – SOC from 13 Oct 44665 – Selling tail (13 Oct) 44750 – VPOC from 12 Oct 44849 – 2-day VPOC (28-29 Sep) |
| Down |
| 44323 – Closing PBL (16 Oct) 44239 – Buying Tail (16 Oct) 44105 – Singles mid (10 Oct) 44029 – VPOC from 09 Oct 43935 – Swing Low (09 Oct) 43782 – Weekly ATR |
You can check the monthly charts & other swing levels for both Nifty & BankNifty here & for the weekly charts & analysis, please click here.
