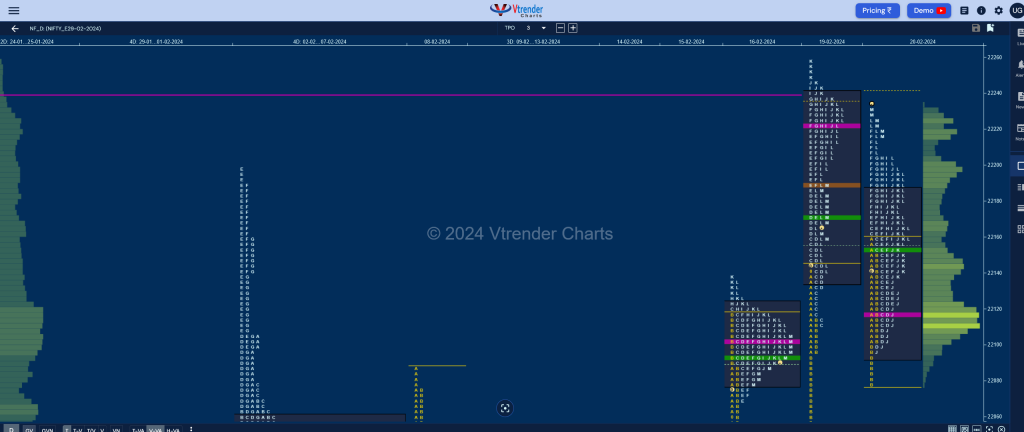
Nifty Feb F: 22217 [ 22234 / 22078 ]

| Open Type |
|---|
| OAIR (Open Auction In Range) |
| Volumes of 11,119 contracts |
| Initial Balance |
|---|
| 82 points (22158 – 22076) |
| Volumes of 34,114 contracts |
| Day Type |
|---|
| Normal Variation – 158 pts |
| Volumes of 1,17,158 contracts |
NF made an OAIR start but remained below previous VWAP of 22173 and probed lower in the IB (Initial Balance) once again completing the 80% Rule as it did in the previous session in 16th Feb’s Gaussian Curve while making a low of 22076 taking support right at the VAL of 22078.
The auction then confirmed an initiative buying tail at lows but made a typical C side extension to 22165 which made the mandatory retracement to day’s VWAP even breaking below it in the D TPO even testing the morning tail as it made a low of 22099 indicating demand coming back.
NF then got back above VWAP and even made couple of REs (Range Extension) higher in the E & F periods where it made a high of 22220 stalling just below the yPOC of 22222 and left a small responsive selling tail hinting at profit booking along with some supply coming back which then forced a probe below VWAP in the J TPO where it even tested the D lows of 22099 but left a fresh PBL at 22096 and made a trending move higher into the close leaving a mini spike from 22215 to 22234 forming an Inside Day.
Click here to view the latest profile in NF on Vtrender Charts
Daily Zones
- Largest volume (POC) was traded at 22118 F and VWAP of the session was at 22154
- Value zones (volume profile) are at 22095-22118-22187
- HVNs are at 21813 (** denotes series POC)
Weekly Zones
- Weekly Charts can be viewed here
- (29 Jan-01 Feb) – NF opened higher this week and remained above previous week’s VWAP of 21540 throughout even making a look up above the highs of 21916 but left a daily FA at 21920 forming overlapping value on all 4 days leaving a Neutral profile and a nice Gaussian Curve with completely higher Value at 21726-21813-21869 with a very prominent POC which will act as a magnet unless we get an initiative move away from here in the coming week
- (19-25 Jan) – NF has formed a Neutral Extreme weekly profile in a relatively large range of 21916 to 21287 with mostly lower Value at 21349-21416-21583 and also represents a Double Distribution shape with the upper HVN at 21804 and a small zone of singles in the middle of the profile from 21640 to 21670 seperating the lower distribution where it has also left a small buying tail at a prior weekly VPOC of 21296 (08-14 Dec) which will be the support zone for the coming week whereas on the upside, this week’s VWAP of 21540 will need to taken out and sustained for a move towards 21804 and the mini tail from 21908
Monthly Zones
- The settlement day Roll Over point (February 2024) is 21419
- The VWAP & POC of Jan 2024 Series is 21581 & 21635 respectively
- The VWAP & POC of Dec 2023 Series is 21226 & 21377 respectively
- The VWAP & POC of Nov 2023 Series is 19562 & 19806 respectively
Business Areas for 21st Feb 2024
| Up |
| 22225 – M TPO VWAP 22260 – Swing High (19 Feb) 22299 – Weekly 3 IB 22348 – 1 ATR (yPOC 22118) 22384 – 1 ATR (yVWAP 22154) |
| Down |
| 22200 – L TPO VWAP 22154 – VWAP (20 Feb) 22118 – dPOC (20 Feb) 22076 – 2-day buy tail 22045 – Buy Tail (16 Feb) |
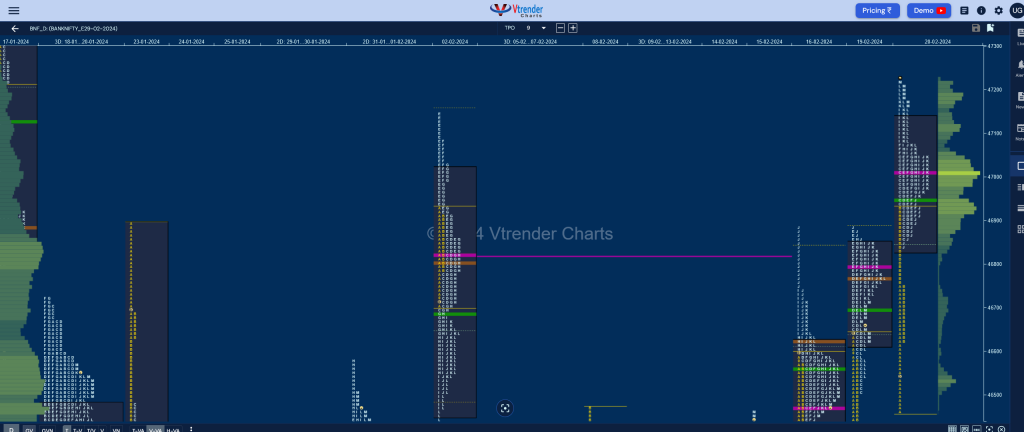
BankNifty Feb F: 47188 [ 47225 / 46464]

| Open Type |
|---|
| OAIR (Open Auction In Range) |
| Volumes of 11,672 contracts |
| Initial Balance |
|---|
| 469 points (46933 – 46464) |
| Volumes of 47,924 contracts |
| Day Type |
|---|
| Normal Variation – 761 points |
| Volumes of 1,92,399 contracts |
to be updated…
Click here to view the latest profile in BNF on Vtrender Charts
Daily Zones
- Largest volume (POC) was traded at 47014 F and VWAP of the session was at 46951
- Value zones (volume profile) are at 46830-47014-47141
- HVNs are at 45603 / 45998 / 46331** (** denotes series POC)
Weekly Zones
- Weekly Charts can be viewed here
- (01-07 Feb) – BNF has formed a Neutral Centre weekly profile as it first took support right at previous week’s VWAP of 45883 leaving a FA on 01st Feb and went on to make a trending move higher taking out the weekly selling tail of 19th-25th Jan profile and even tagged the prior week’s extension handle of 47115 but could only manage to tag 47145 as sellers came back strongly and went on to not only retrace the entire upmove but made new lows for the week at 45740 taking support just above previous week’s POC of 45717 and gave a bounce back to 46296 on the last day. Value for the week was mostly higher Value at 45897-46114-46410 with a prominent TPO HVN 45999 which will be the support for the coming week
- (29-31 Jan) – BNF took support multiple times at previous week’s VWAP of 45492 forming a Neutral Extreme weekly profile to the upside giving a move away from the prominent POC of 45717 on the last day where it went on to hit new highs of 46444 forming overlapping to higher Value at 46429-45717-45994 but this week’s NeuX VWAP of 45883 will be the important reference going forward if it has to continue higher towards the selling tail from 46720 & extension handle of 47115 in the coming week
- (19-25 Jan) – BNF has also formed a Neutral Extreme weekly profile in a range of 46892 to 44851 with completely lower Value at 44903-44997-45626 but has seen the POC shift to the lows hinting at profit booking by sellers so can give a bounce with this week’s VWAP of 45492 being an important reference for the buyers to take out in case of the upmove to continue in the new series
Monthly Zones
- The settlement day Roll Over point (February 2024) is 44999
- The VWAP & POC of Jan 2024 Series is 46353 & 48119 respectively
- The VWAP & POC of Dec 2023 Series is 47337 & 47918 respectively
- The VWAP & POC of Nov 2023 Series is 43837 & 43619 respectively
Business Areas for 21st Feb 2024
| Up |
| 47225 – Spike high 47362 – C TPO VWAP (17 Jan) 47492 – Weekly HVN 47655 – VPOC from 17 Jan 47751 – Weekly 3 IB 47841 – 1 ATR (yPOC 47014) |
| Down |
| 47161 – Spike low 47014 – dPOC (20 Feb) 46890 – J TPO POC (20 Feb) 46755 – Ext Handle (20 Feb) 46622 – Buy Tail (20 Feb) 46493 – B TPO VWAP (19 Feb) |
You can check the monthly charts & other swing levels for both Nifty & BankNifty here & for the weekly charts & analysis, please click here.
