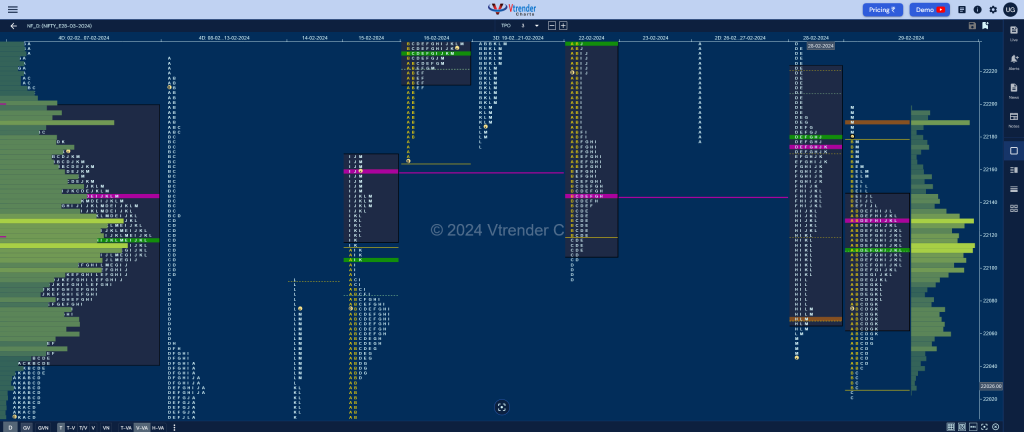
Nifty Mar F: 22160 [ 22199 / 22022 ]

| Open Type |
|---|
| OA (Open Auction) |
| Volumes of 13,058 contracts |
| Initial Balance |
|---|
| 150 points (22176 – 22026) |
| Volumes of 43,965 contracts |
| Day Type |
|---|
| Neutral – 178 pts |
| Volumes of 1,81,719 contracts |
to be updated…
Click here to view the latest profile in NF on Vtrender Charts
Daily Zones
- Largest volume (POC) was traded at 22188 F and VWAP of the session was at 22112
- Value zones (volume profile) are at 22093-22188-22195
- NF confirmed a FA at 22022 on 29/02 and the 1 ATR objective comes to 22239
- NF confirmed a FA at 22465 on 23/02 and is currently on ‘T+5’ Days
- HVNs are at NA (** denotes series POC)
Weekly Zones
- Weekly Charts can be viewed here
- (23-29 Feb) – to be updated
Monthly Zones
- The settlement day Roll Over point (March 2024) is 22188
- The VWAP & POC of Feb 2024 Series is 21956 & 21930 respectively
- The VWAP & POC of Jan 2024 Series is 21581 & 21635 respectively
- The VWAP & POC of Dec 2023 Series is 21226 & 21377 respectively
Business Areas for 01st Mar 2024
| Up |
| 22176 – Sell tail (29 Feb) 22209 – Weekly VWAP 22239 – 1 ATR (FA 22022) 22277 – D tail mid (28 Feb) 22320 – Ext Handle (28 Feb) |
| Down |
| 22155 – M TPO low 22112 – NeuX VWAP (29 Feb) 22070 – PBL (29 Feb) 22022 – FA (29 Feb) 21983 – K TPO VWAP (14 Feb) |
Spot Hypos for 01st Mar 2024
| Up |
| 22022 – IBH (29 Feb) 22077 – 1 ATR (FA 21860) 22128 – D tail mid (28 Feb) 22168 – Ext Handle (28 Feb) 22208 – C TPO H/B (28 Feb) |
| Down |
| 21982 – M TPO low (29 Feb) 21930 – Feb POC 21860 – FA (29 Feb) 21823 – PBL (15 Feb) 21765 – K TPO h/b (14 Feb) |
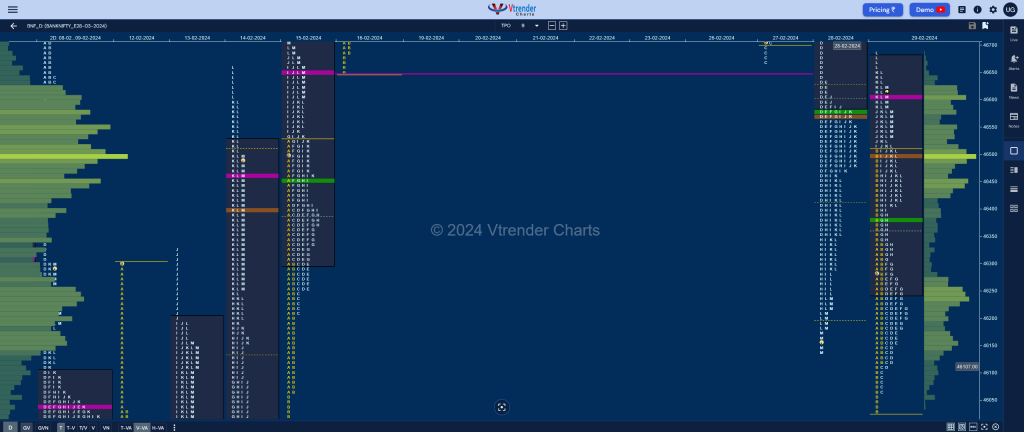
BankNifty Mar F: 46546 [ 46689 / 46030]

| Open Type |
|---|
| OA (Open Auction) |
| Volumes of 11,002 contracts |
| Initial Balance |
|---|
| 476 points (46506 – 46030) |
| Volumes of 47,079 contracts |
| Day Type |
|---|
| 3-1-3 profile– 659 points |
| Volumes of 1,96,475 contracts |
to be updated…
Click here to view the latest profile in BNF on Vtrender Charts
Daily Zones
- Largest volume (POC) was traded at 46610 F and VWAP of the session was at 46384
- Value zones (volume profile) are at 46250-46610-46674
- HVNs are at NA** (** denotes series POC)
Weekly Zones
- Weekly Charts can be viewed here
- (22-29 Feb) – to be updated
Monthly Zones
- The settlement day Roll Over point (March 2024) is 46610
- The VWAP & POC of Feb 2024 Series is 46119 & 45700 respectively
- The VWAP & POC of Jan 2024 Series is 46353 & 48119 respectively
- The VWAP & POC of Dec 2023 Series is 47337 & 47918 respectively
Business Areas for 01st Mar 2024
| Up |
| to be updated… |
| Down |
| to be updated… |
Spot Hypos for 01st Mar 2024
| Up |
| 46233 – M TPO halfback 46360 – Tail (27th Feb) 46523 – Ext Handle (28 Feb) 46614 – SOC (28 Feb) 46754 – FA (28 Feb) |
| Down |
| 446120 – M TPO low 45995 – Halfback (29 Feb) 45864 – dPOC (29 Feb) 45702 – Buy Tail (29 Feb) 45540 – VPOC (14 Feb) |
You can check the monthly charts & other swing levels for both Nifty & BankNifty here & for the weekly charts & analysis, please click here.
