Nifty Sep F: 11059 [ 11077 / 10890 ]
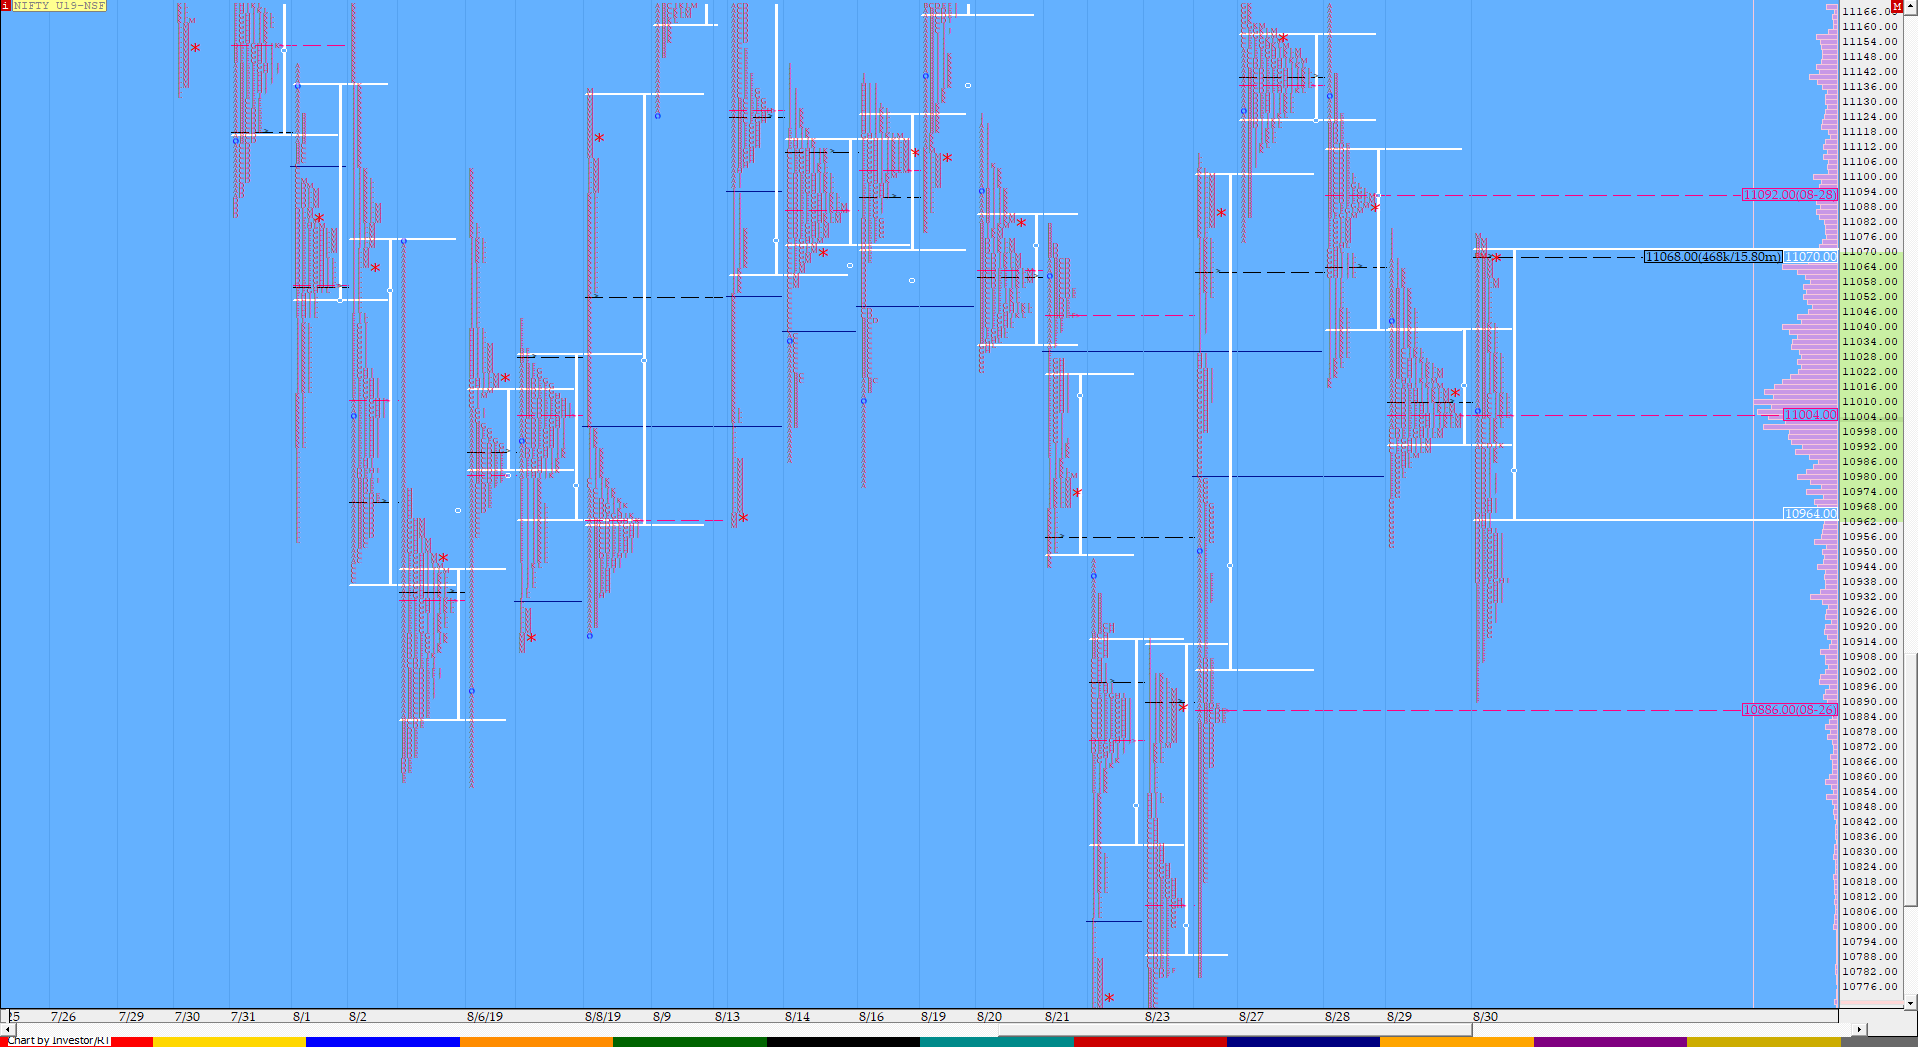
NF opened around the yPOC of 11010 and took support at yVAL of 10994 as it made a low of 10991 in the opening 10 minutes to probe higher in the IB (Initial Balance) making a high of 11075 as soon as the ‘B’ period started but then retraced the entire up move to break below VWAP to closed at 11010 indicating that the FA (Failed Auction) of 11079 was very much in play. The auction then made a RE (Range Extension) lower in the ‘C’ period and followed it up with multiple REs down for the next 3 periods as it broke below the Trend Day VWAP of 10951 in the ‘D’ period & completed the 1 ATR move of 10906 from the FA in the ‘E’ period and almost tagged the Trend Day vPOC of 10886 as it made a low of 10890 in the ‘F’ period where it left a small buying tail indicating that the probe to the downside could have completed. This was further confirmed in the ‘G’ period as NF not only stopped the OTF (One Time Frame) move down since ‘B’ but also started a reverse OTF move to the upside as NF made higher highs on the remaining 5 periods of the day and even tagged the morning highs making marginal new highs of 11077 in the ‘M’ period but got stalled just below the FA indicating return of supply in this zone. NF has formed overlapping Value for the last 2 days with HVNs at 11069 & 11004 which would be the important references for the open in the coming session.
- The NF Open was an Open Auction In Range (OAIR)
- The day type was a Neutral Day
- Largest volume was traded at 11069 F
- Vwap of the session was at 10981 with volumes of 167.8 L and range of 187 points as it made a High-Low of 11077-10890
- NF confirmed a FA at 11079 on 29/08 & tagged the 1 ATR objective of 10906 on 30/08. The 2 ATR move down comes to 10733
- The Trend Day POC & VWAP of 26/08 at 10886 & 10951 would be important references on the downside.
- The Trend Day POC & VWAP of 19/07 at 11478 & 11523 are now positional references on the upside.
- The higher Trend Day VWAP of 05/07 at 11965 is another important reference higher.
- The settlement day Roll Over point is 11010
- The VWAP & POC of Aug Series is 10966 & 10984 respectively.
- The VWAP & POC of Jul Series is 11575 & 11547 respectively.
- The VWAP & POC of Jun Series is 11833 & 11714 respectively.
You can check the monthly charts & other swing levels for Nifty & NF here & for the weekly charts & analysis, please click here.
Daily Zones:
- Value zones (volume profile) are at 10968-11069-11074
Hypos / Estimates for the next session:
a) NF has immediate supply zone at 11079-91 above which it could rise to 11107-115 & 11138-142
b) Immediate support is at 11049 below which auction can test 11022-07 / 10984-977 & 10962
c) Above 11142, NF can probe higher to 11157 / 11175-180 & 11195
d) Below 10962, auction becomes weak for 10944-923 & 10906
e) If 11195 is taken out, the auction can rise to 11215 / 11233-238 & 11252
f) Break of 10906 can trigger a move lower to 10890-886 & 10864-851
BankNifty Sep F: 27521 [ 27686 / 27151 ]
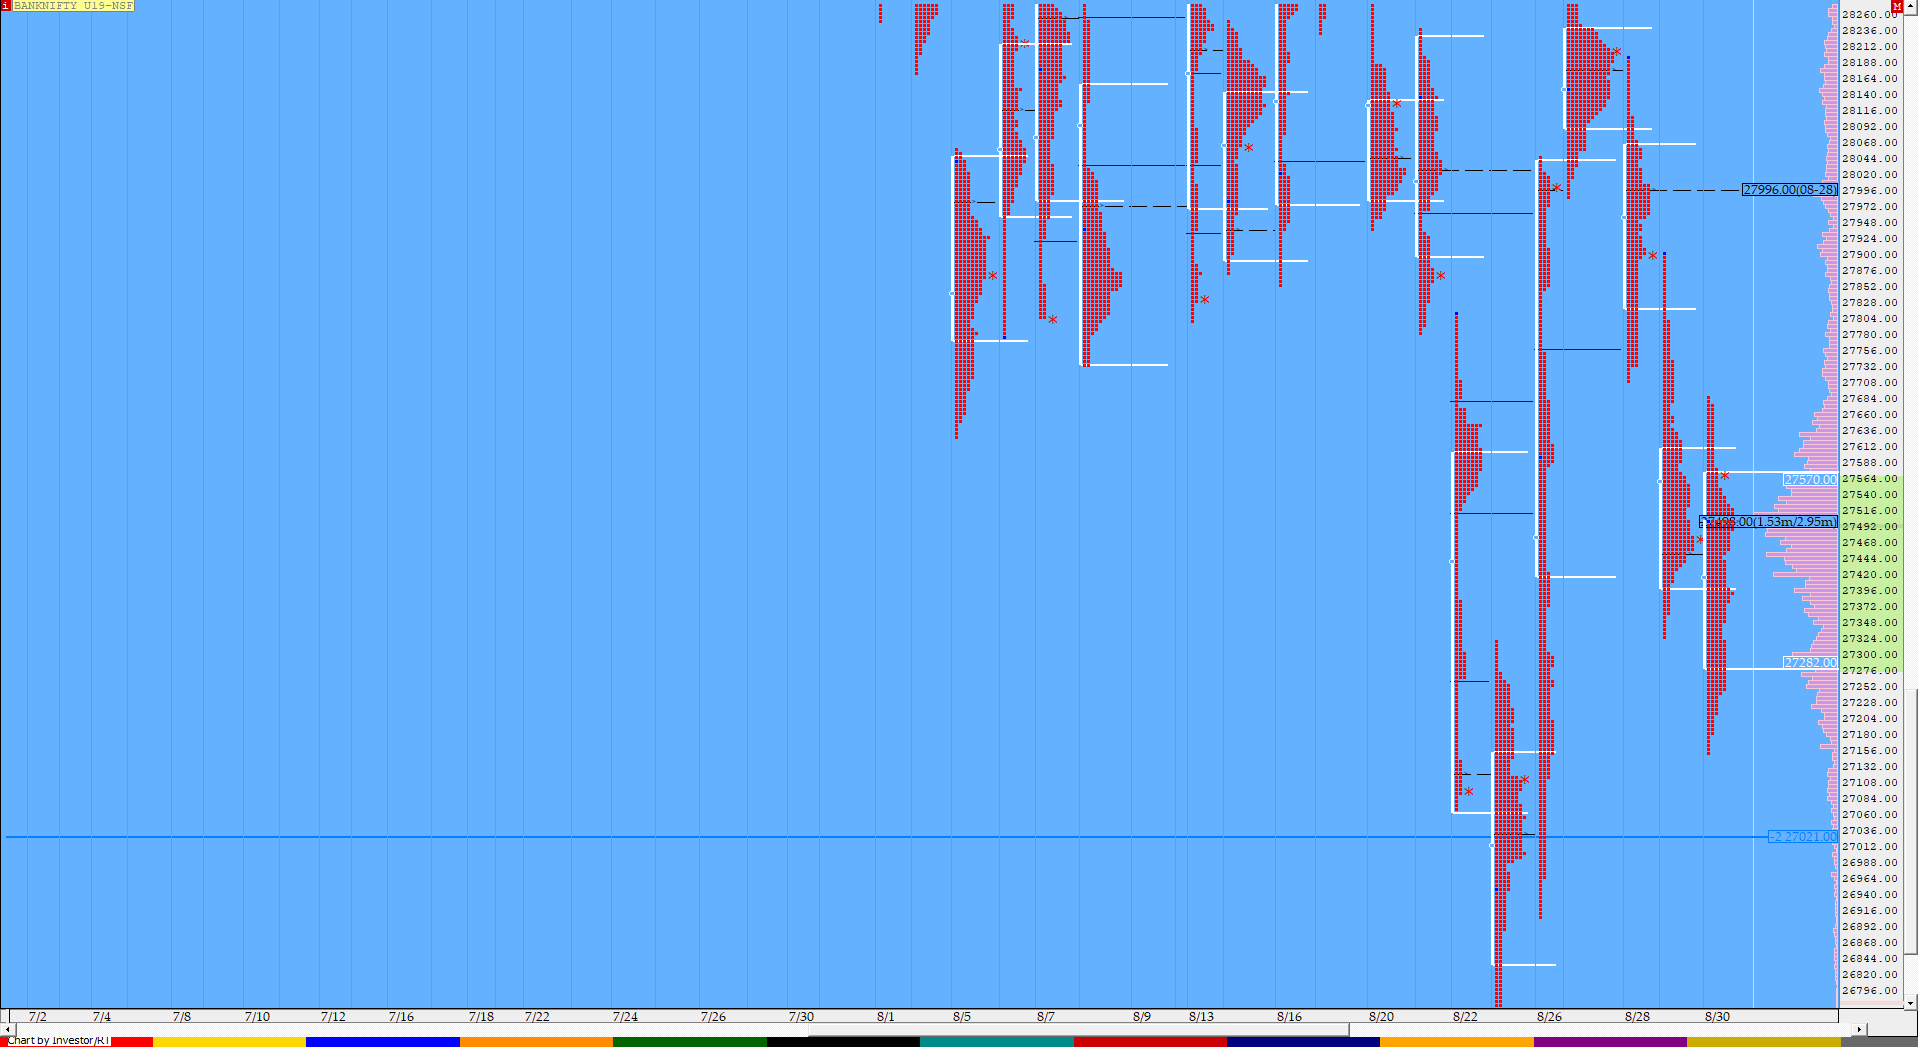
BNF opened with a gap up at 27501 & took support at the yPOC & HVN of 27450 in the opening 10 minutes after which it probed higher as it made highs of 27686 in the ‘A’ period but could not get above this in the ‘B’ period as it started a OTF probe lower breaking below VWAP & then the IBL making lower lows till the ‘F’ period where it made lows of 27151 completing the 2 IB objective to the downside. The auction then started to probe higher as it stopped the OTF move down in the ‘G’ period making higher highs for the first time in the day and continued this till the ‘J’ period where BNF got above VWAP and made highs of 27549. The ‘K’ period saw a dip below VWAP as the auction left a pull back low of 27344 where it got rejected after which it resumed the probe higher to get above 27549 and made new highs of 27577 in the ‘M’ period while building big volumes at 27500-510 zone which would be the immediate reference on the downside in the next session.
- The BNF Open was an Open Auction In Range (OAIR)
- The day type was a Normal Variation Day – Down
- Largest volume was traded at 27498 F
- Vwap of the session was also at 27404 with volumes of 46.3 L in a session which traded in a range of 535 points making a High-Low of 27686-27151
- The Trend Day VWAP of 19/07 at 30085 is now positional supply point.
- The higher Trend Day VWAP of 18/07 & 08/07 at 30598 & 30995 remain important references going forward
- The settlement day Roll Over point is 27450
- The VWAP & POC of August Series 27858 & 27960 respectively
- The VWAP & POC of Jul Series is 30425 & 30586 respectively.
- The VWAP & POC of Jun Series is 30914 & 30961 respectively.
For the Monthly charts & other swing levels for BankNifty & BNF click here & for the weekly charts & analysis, please click here.
Daily Zones:
- Value zones (volume profile) are at 27290-27498-27575
Hypos / Estimates for the next session:
a) BNF needs to get above 27585 and sustain for a rise to 27627 / 27674-690 & 27735-750
b) Staying below 27510-490, the auction could test 27400 / 27365-350 & 27300
c) Above 27750, BNF can probe higher to 27800-830 / 27900-915 & 27996-28000
d) Below 27300, lower levels of 27242 / 27192-183 & 27096 could come into play
e) Sustaining above 28000, BNF can give a fresh move up to 28075-120 & 28176
f) Break of 27096 could trigger a move down 27025 / 26965 & 26905-890
For more tradeable ideas and intraday trading strategies based on MarketProfile and the OrderFlow live charts with OrderFlow analysis Live, subscribe to the trading room. The Vtrender Trading Room hosts India’s largest MarketProfile community live every trading session from 9.15 am to 3.30 pm.
If not a Trading Room member you can get immediate access at – https://in.explara.com/e/vtrender–trading–room/checkout


