Nifty Spot: 22604 [ 22783 / 21777 ]
Previous month’s report can be viewed here

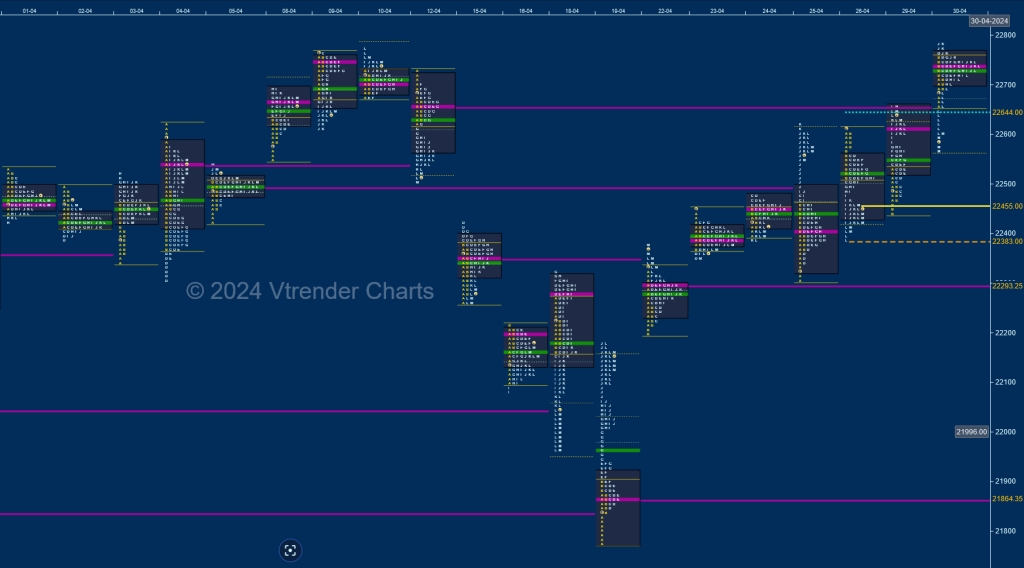
Nifty opened the month with a small gap up but saw 2 way probes over the first 5 days forming a balance getting rejected on the downside upon entry into previous month’s Value on couple of occasions as it left a buying tail from 22346 to 22303 where as the upside could not sustain above the RO point of 22607 as it left a selling tail from 22580 to 22619 and closed just above the ultra prominent POC of 22493.
The second week saw the auction make an attempt to probe higher after leaving an initiative buying tail on 08th where it made new ATH of 22697 and continued the imbalance on 09th making new highs of 22768 but it came off the dreaded C side extension triggering a liquidation break and a Neutral Extreme Day Down confirming a FA (Failed Auction) at highs and although this FA got tagged the very next day, it came off a spike move in the L TPO which was more of a rejection indicating that the PLR (Path of Least Resistance) had turned to the downside and more confirmation came in form of a Double Distribution (DD) Trend Day down on the 12th where it almost tagged the prominent VPOC of 22493 while making a low of 22503.
The downside imbalance continued in the third week as Nifty not only opened with a gap down but made lower lows on the first four days tagging the VPOCs of 22050 & 21840 from 26th & 20th Mar respectively while testing the March’s buying tail from 21793 to 21710 as it made a low of 21777 on 19th but left a good A period buying tail marking the return of aggressive buying and a Trend Day Up climbing back above Mar’s POC & VWAP of 22001 & 22168 respectively with the POC staying lower at 21864 clearly displaying that the PLR was now to the upside.
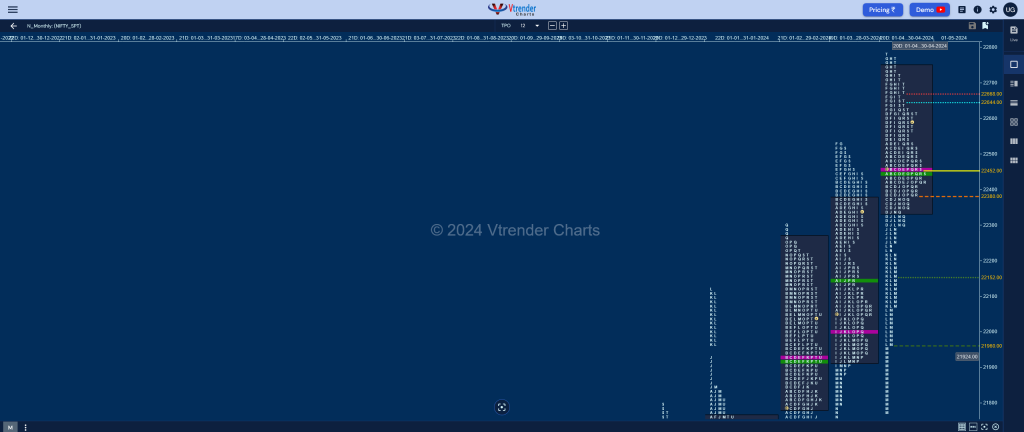
More confirmation came in form of a higher open of almost 200 points in the fourth week as the auction slowly & steadily formed Value in the gap down zone of 15th Apr leaving another daily VPOC at 22293 and formed a 4-day balance building a prominent POC at 22409 where it eventually closed the week and made higher highs on the last 2 days of the month testing the poor highs of 22775 while recording new ATH of 22783 but could not sustain triggering a liquidation break down to 22568 into the close. Nifty has formed a Neutral monthly profile with mostly higher Value at 22335-22457-22741 with a Scene Of Crime (SOC) on the upside at 22676 which will be the immediate hurdle for the coming month with the series VWAP of 22402 being the important swing reference on the downside along with the lower SOC of 22153 & this month’s buying tail of 21961 to 21777 as the other supports.

Monthly Zones
- The settlement day Roll Over point (May 2024) is 22648
- The VWAP & POC of Apr 2024 Series is 22402 & 22457 respectively
- The VWAP & POC of Mar 2024 Series is 22168 & 22001 respectively
- The VWAP & POC of Feb 2024 Series is 21956 & 21930 respectively
- The VWAP & POC of Jan 2024 Series is 21581 & 21635 respectively
- The VWAP & POC of Dec 2023 Series is 21226 & 21377 respectively
- The VWAP & POC of Nov 2023 Series is 19652 & 19806 respectively
BankNifty Spot: 49396 [ 49974 / 46579 ]
Previous month’s report can be viewed here

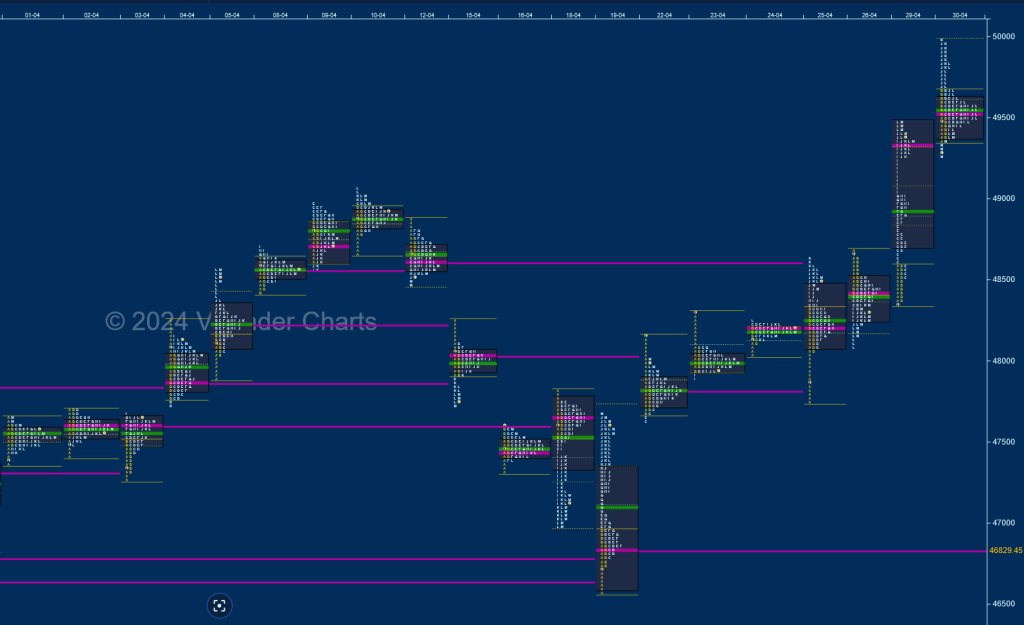
BankNifty opened the month with a 3-day narrow range balance as it previous month’s POC of 47300 while making a low of 47279 on 03rd Apr taking support there and formed an ultra-prominent POC at 47610 from where it moved away to the upside on 04th with the help of a gap up where it not only took out the SOC of 47747 along with 07th Mar’s VPOC of 47855 but went on to negate the monthly selling tail from 48071 to 48161 while making a high of 48254 and continued to trended higher for the next 5 sessions even taking out the highs of Jan 2024 & Dec 2023 to record new ATH of 49057 on 10th Apr where it left a small responsive selling tail along with a prominent POC at 48879.
The auction then confirmed end of the upside imbalance as it left an A period selling tail right at 48879 triggering a OTF (One Time Frame) probe lower over the next 4 sessions aided by couple of big gap down opens as it even broke below the prominent VPOC of 47610 and went on to make new lows for the month negating the 28th Mar’s initiative buying tail and tagging the twin VPOCs of 46788 & 46634 from 27th & 26th respectively while making a low of 46579 in the A period on 19th Apr but left an initiative buying tail and formed a Double Distribution Trend Day Up indicating that the PLR was now again to the upside.
BankNifty then started the fourth week with a big gap up of 571 points on 22nd Apr leaving a freak OH tick at 48146 and probed lower closing the gap in the IB after which it made a dreaded C side extension to 47628 which was swiftly rejected reflecting failure of the sellers resulting in a move back to 48009 into the close and a higher open on 23rd where it hit 48302 stalling right below the gap mid-point from 15th Apr as the sellers made another attempt to strike but failed to make any meaningful extension lower forming a ‘b’ shape profile with a prominent POC at 47997 which was followed by the narrowest daily range of just 218 points of the year 2024 on 24th where it remained above 47997 but could not take out previous highs suggesting equal fight between 2 big players.
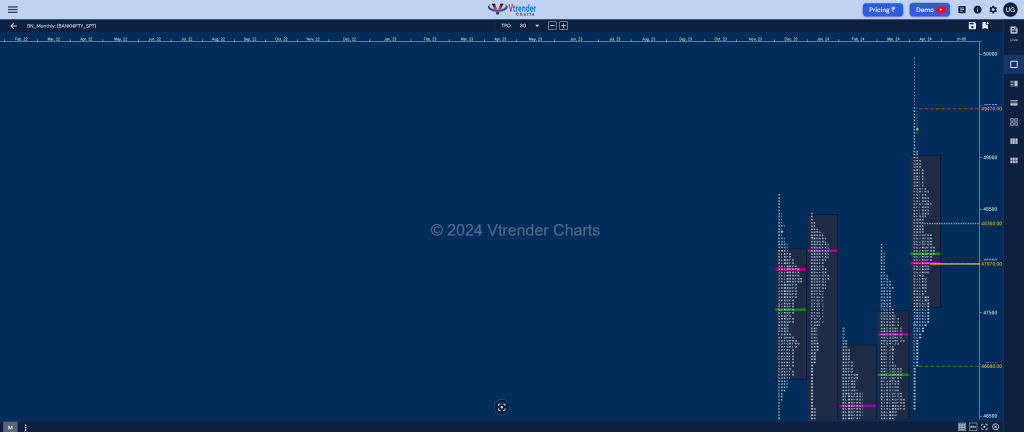
The sellers got the first advantage with a gap down open of 416 points on 25th Apr where the auction tagged the daily VPOCs 47827 from 22nd while making a low of 47737 but left a very important A period buying tail till 48052 and went on to close the 15th Apr gap zone as it hit that day’s VPOC of 48613 into the close suggesting that the buyers had taken control and though the next day they formed a balance with overlapping value making a low of 48088, the PLR remained to the upside as BankNifty made a huge 1131 point range Trend Day Up on 29th taking out previous highs of 49057 and hitting new ATH of 49473 and saw this imbalance continue on the last day where it remained in a narrow range of 319 points for most part of the day but saw a big extension higher in the J TPO which was followed by new ATH of 49974 in the K but saw big profit booking taking place which forced the laggard longs to quit as it went on to form a Neutral Extreme Day Down making new lows of 49249 into the close. The Monthly profile however is a Neutral Extreme one to the upside with completely higher Value at 47557-47994-49010 which also has tails at both ends with the buying one from 46982 to 46579 and the selling one from 49473 to 49974 which will be the important references for the month of May with the series VWAP of 48176 being a swing support below May’s RO point of 48360.

Monthly Zones
- The settlement day Roll Over point (May 2024) is 48360
- The VWAP & POC of Apr 2024 Series is 48176 & 47994 respectively
- The VWAP & POC of Mar 2024 Series is 47051 & 47300 respectively
- The VWAP & POC of Feb 2024 Series is 46119 & 45700 respectively
- The VWAP & POC of Jan 2024 Series is 46353 & 48119 respectively
- The VWAP & POC of Dec 2023 Series is 47337 & 47918 respectively
- The VWAP & POC of Nov 2023 Series is 43837 & 43619 respectively
