
Love Vtrender Charts? Check out our new offer!
In 1984, a Chicago Board of Trade member named Pete Steidlmayer solved a problem that had plagued traders for over a century: How do you see WHERE the market actually does business, not just where it went?
Every chart showed price movement over time. But none revealed the auction process - where buyers and sellers agreed on value, where they fought, and where the real institutional money was positioning. Pete's breakthrough would revolutionize institutional trading forever and lay the foundation for what we now call Market Profile.
Today, at Vtrender, we've taken Pete's original auction theory and evolved it for the modern NSE derivatives market - integrating real-time Order Flow, institutional intent detection, and live structural analysis across 11,000+ Indian instruments. This is the story of that evolution.
Before 1984, traders had price charts and volume bars. That was it. You could see that Soybeans ( Pete traded agri commodities) traded from 650 to 675, but you had no idea if the market:
Spent most of its time at 665 (establishing value)
Rejected 675 immediately (showing resistance)
Developed in a balanced auction or trended directionally
Pete Steidlmayer, CBOT member #141, changed everything with a simple insight: Add time to the price equation.
Pete's Time Price Opportunity (TPO) charts divided each trading session into 30-minute periods, labeled A through Z. Each letter represented WHERE price traded DURING that specific time period.
Here's what made it revolutionary:
Market-Generated Information: What the market itself was telling you through its auction process
Value Area Identification: Where 70% of trading activity occurred (where institutions saw fair value)
Point of Control (POC): The price level with maximum time spent (highest conviction level)
Market Structure Types: Normal days (balanced auctions) vs Trend days (directional conviction)
Understanding MarketProfile - https://vtrender.com/posts/understanding-market-profile-a-modern-traders-guide
The Chicago Board of Trade didn't just endorse Market Profile - they made it an official analytical tool. Why? Because for the first time, traders could see:
Where institutional money was accumulating (heavy time spent at specific levels)
Market acceptance vs rejection (quick moves vs sustained activity)
Auction failures (when markets couldn't sustain directional moves)
Value migration patterns (how fair value shifted over time)
Pete had given traders X-ray vision into market structure.
Electronic trading transformed Pete's original methodology. Suddenly, exchanges could provide not just time data, but precise volume information at every price level. The equation evolved:
Original Formula: Price × Time = Market Profile
Enhanced Formula: Price × Volume = Volume Profile
1995-2000: Volume Profile Emergence
Real volume data replaced time proxies
More precise value area calculations
Better institutional footprint detection
2000-2005: Multi-Timeframe Analysis
Intraday profiles within longer-term composites
Weekly and monthly structural analysis
Improved trend vs balance identification
2005-2010: Algorithmic Trading Impact
High-frequency trading begins affecting traditional patterns
Need for faster, more granular analysis
Introduction of real-time profile development
Despite technological evolution, Pete's core principles proved timeless:
Markets are auctions seeking fair value
Time and volume reveal institutional intent
Structural patterns repeat across all timeframes
Balance leads to imbalance, and imbalance seeks balance
By 2010, algorithmic trading dominated global markets. Traditional Market Profile concepts still worked, but traders needed faster, more granular insights. The solution: Order Flow analysis - seeing not just where the market traded, but how aggressively it traded there.
Order Flow analysis reveals:
Initiative vs Responsive activity (who's driving the move?)
Absorption patterns (where institutional money is defending levels)
Momentum shifts (when buying/selling pressure changes)
Micro-structure inefficiencies (short-term trading opportunities)
This wasn't replacing Market Profile - it was enhancing it with real-time precision.
Indian derivatives markets have distinct characteristics that require adapted Market Profile approaches:
Trading Hours Impact (9:15 AM - 3:30 PM)
Compressed time for profile development
Pre-market analysis becomes crucial
Overnight inventory effects from global markets
Weekly Expiry Dynamics
Profile patterns change during expiry weeks
Options BIG MONEY hedging visible in futures profiles
Gamma positioning affects structural development
Institutional Flow Patterns
RETAIL/ PRO activity creates distinct volume signatures
Settlement-driven positioning in monthly series
Option Market ( 40000 CR premium everyday) correlations with index movements
Market Structure Differences
Bank Nifty vs Nifty profile characteristics
Sector rotation patterns visible in broader composites
Options premiums affecting futures auction development
1. Speed of Information NSE markets move fast. Weekly expiries mean constant structural changes. Traders need real-time profile updates, not end-of-day analysis.
2. Multiple Product Integration Modern NSE traders don't just trade futures. They need to see how index futures, options flow, and sector movements interact in real-time.
3. Institutional Intent Detection With increasing algo participation, identifying genuine institutional activity from noise becomes crucial.
Real-Time Structural Analysis
Live DPOC (Developing Point of Control) alerts as profiles evolve
Instant value area updates during session development
Real-time balance vs imbalance identification
Order Flow Integration
Initiative Buying/Selling (IB/IS) detection at profile key levels
Volume cluster analysis at POCs and value boundaries
Absorption pattern identification during institutional accumulation
Multi-Instrument Monitoring
Simultaneous profile analysis across Nifty, Bank Nifty, FinNifty, MidCap Nifty
Cross-instrument structural correlation analysis
Options flow impact on futures profile development
NSE-Specific Enhancements
Weekly expiry cycle adaptation algorithms
FII/DII flow pattern recognition
Pre-market to regular session transition analysis
At Vtrender, we don't just show you Market Profile charts. We show you:
WHERE the market is developing structure (Market Profile)
HOW aggressively it's trading there (Order Flow)
WHY it's moving (Options flow and institutional positioning)
This trilogy creates the complete picture Pete envisioned - but with modern precision and NSE-specific adaptation.
"Price tends to return to previous session POCs"
Real-time POC alerts when price approaches significant levels
Order Flow confirmation showing institutional interest at POC tests
Options analytics revealing market maker positioning around POC levels
Live commentary in our trading desk explaining the setup development
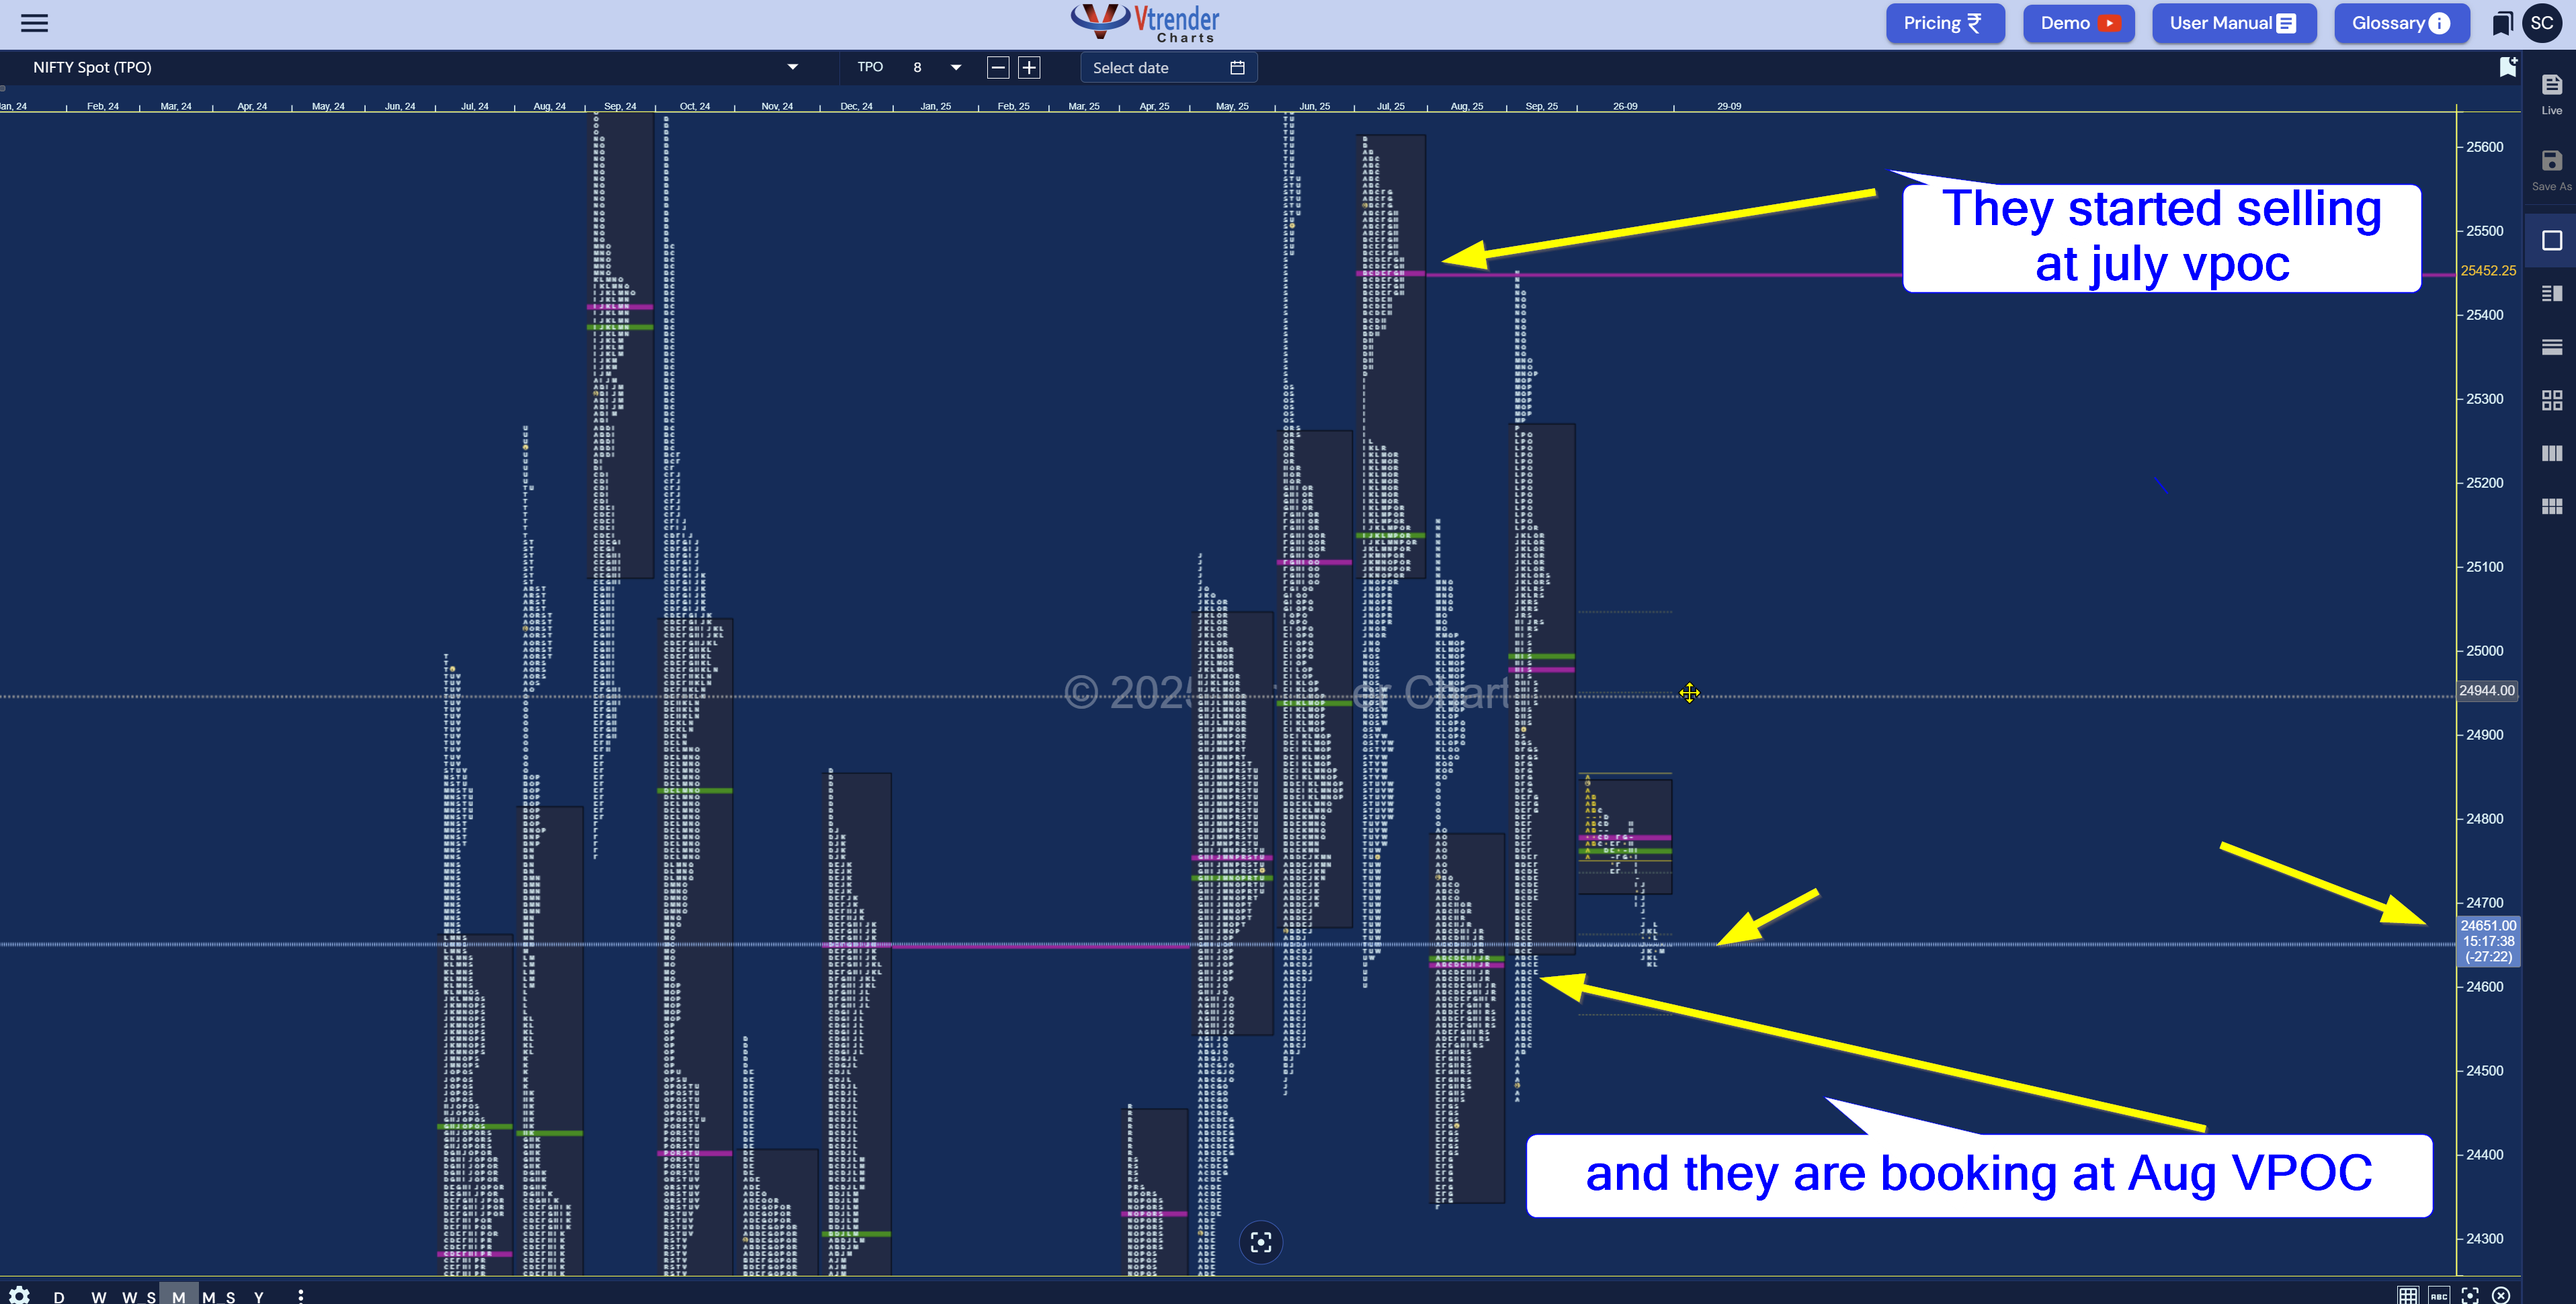
Traditional Approach: Mark previous POCs on chart, wait for price to reach them
Vtrender's Enhanced Approach:
Pre-market: Analyze overnight development relative to previous value areas
Opening: Real-time profile development with DPOC migration alerts
Intraday: Order Flow confirmation at key structural levels
Integration: Options gamma positioning effects on profile formation
Execution: Live desk guidance on timing entries using all three analytical layers
AI-Enhanced Pattern Recognition
Machine learning identification of institutional footprints
Predictive structural analysis based on historical patterns
Automated alert systems for high-probability setups
Real-Time Institutional Flow Detection
Advanced algorithms tracking large participant activity
Cross-asset correlation analysis
Global market influence integration
Predictive Structural Analysis
Probability-based profile development scenarios
Risk-adjusted position sizing based on structural analysis
Automated trade management using profile-based levels
Building your Orderflow method- https://vtrender.com/posts/building-your-order-flow-trading-method-from-nse-data-to-profitable-decisions
Despite technological advancement, Pete's core insights remain the foundation:
Markets are auctions - This fundamental truth doesn't change
Structure repeats - Auction patterns remain consistent across timeframes
Volume reveals intent - Where institutions deploy capital matters most
Balance seeks imbalance - Market rhythms continue unchanged
The micro balance discussed - https://vtrender.com/posts/the-micro-balance-revolution-bringing-institutional-market-profile-to-indian-derivatives
Understanding Market Profile's evolution gives you perspective on:
What works across all market conditions (Pete's timeless principles)
What requires modern adaptation (technology-enhanced analysis)
How to integrate multiple analytical layers (structure + flow + options)
We've spent years perfecting this integration for NSE markets specifically:
Historical Depth: Understanding Pete's original concepts
Modern Precision: Real-time Order Flow and options analytics
Local Expertise: NSE-specific patterns and institutional behavior
Practical Application: Live trading desk where theory meets reality
Market Profile has evolved from Pete's hand-drawn TPO charts to sophisticated real-time analytical systems. But the goal remains the same: Understanding where the market wants to do business.
At Vtrender, we honor Pete's original vision while embracing modern technological capabilities. Our platform doesn't just show you what happened - it reveals what's happening now and helps you position for what's likely to happen next.
The evolution continues - and it's happening in real-time on NSE markets every trading day.
Start Your Journey:
Free Charts Trial - See our real-time Market Profile and Order Flow integration
Market Profile E-Course - Master the concepts from Pete's basics to modern applications
Live Trading Desk - Apply evolved Market Profile concepts in real NSE market conditions
Learn More:
Market Profile Terminology Guide - Complete glossary of concepts
Popular Trading Setups - Practical strategies using evolved concepts
What is Market Profile - Foundation concepts explained
The evolution from Pete's revolutionary insight to modern NSE trading continues. Be part of it.

Markets don't move because indicators change.
Indicators change because markets move.
A practical reference for NSE & BSE derivatives traders. 366 pages, built to sit open beside live charts.