Nifty Spot Weekly Profile (16th to 20th September)
Spot Weekly 11274 [ 11382 / 10670 ]
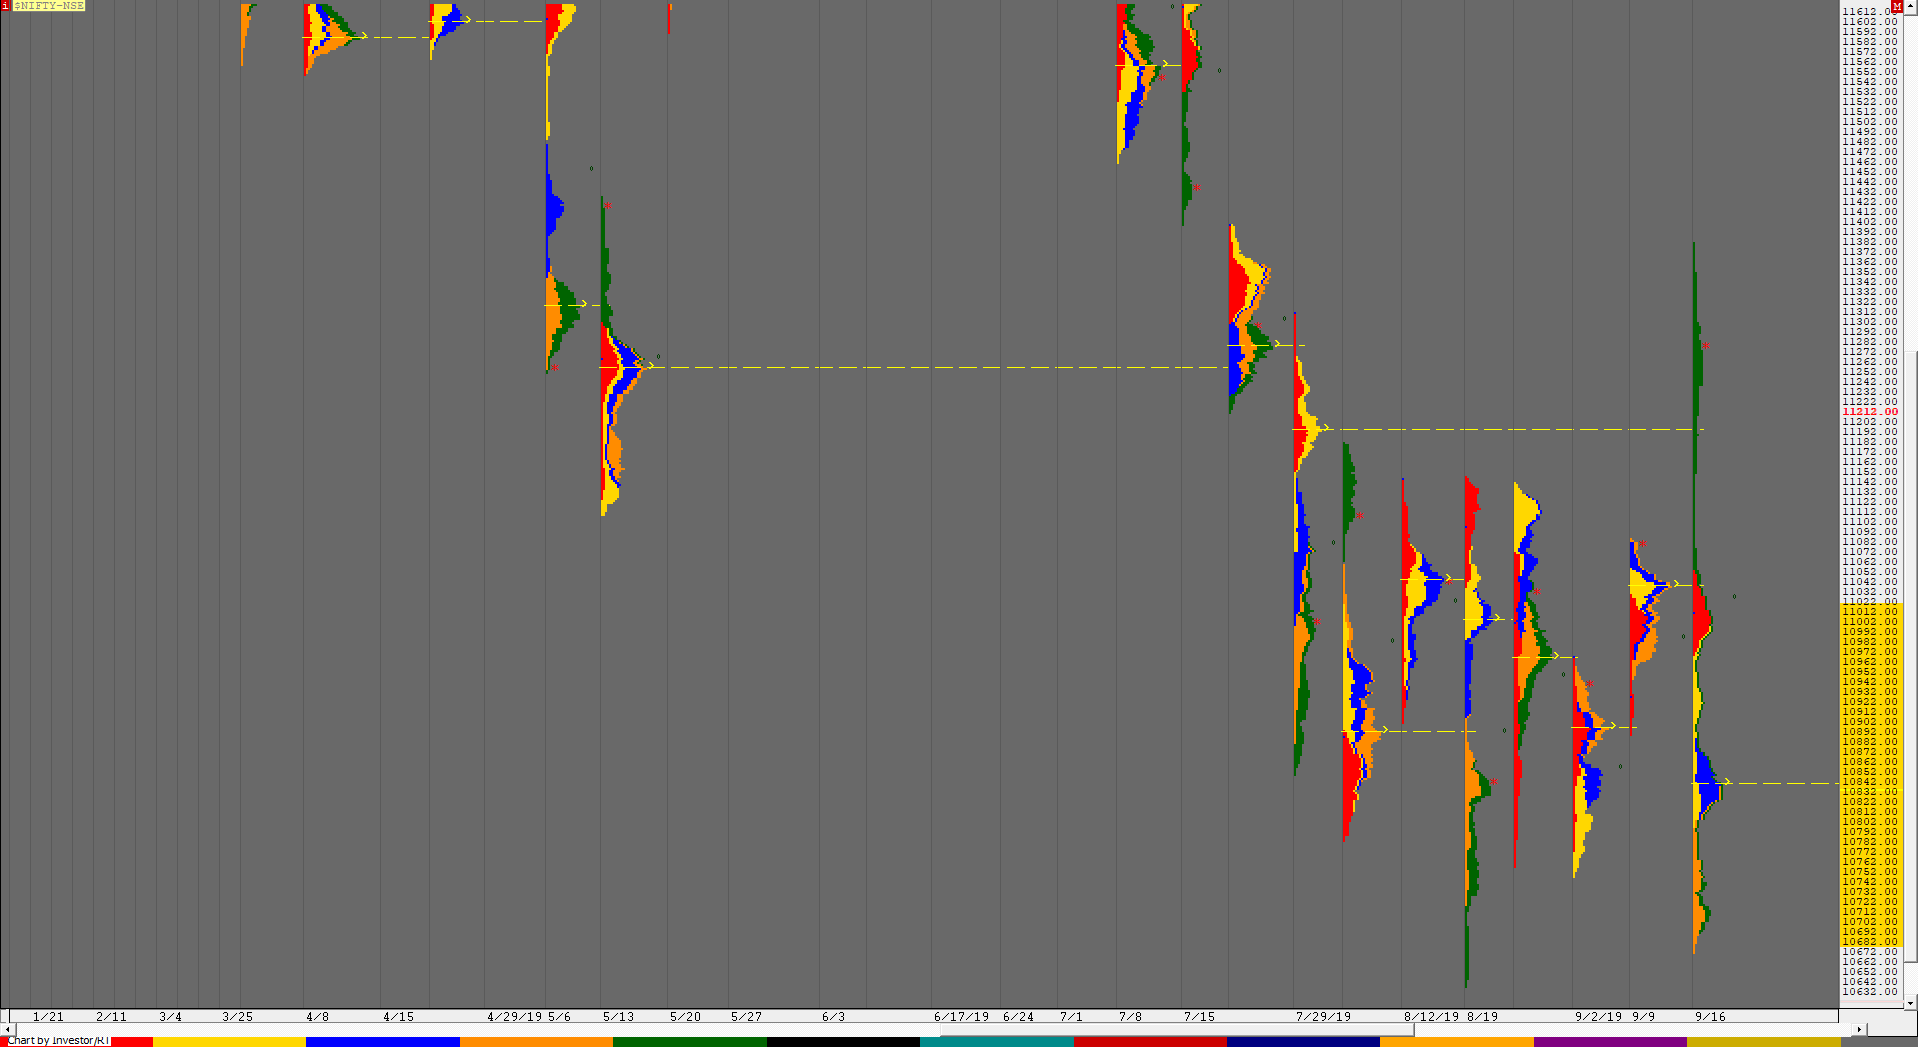
Nifty opened this week with a gap down rejecting the spike of Friday and took support just above the weekly VAL of 10972 as it made a low of 10988 from where it began to probe higher to get back into the spike zone and tagged the weekly VAH of 11042 as it made a high of 11053 but could not sustain and got back below the weekly VAH and completed the 80% Rule as it made new day lows of 10968 leaving a Neutral Day with a weak close. The auction then gave a Open Drive down on Tuesday after making a OH (Open=High) start and made an OTF (One Time Frame) move lower all day to break below previous week’s low leaving a Trend Day down in the process where it made lows of 10796. The imbalance of 250 points from Monday afternoon to Tuesday close led to balance on Wednesday as Nifty made an inside day & remained in the IB (Initial Balance) range of just 80 points all day. The first 3 days of the week added to the bigger time frame composite forming from 31st July making the profile smoother with the composite Value at 10812-11004-11078 (click here to view the chart) and as mentioned in the previous week’s report looked ready to give a move away from here and this seemed to be happening as the auction gave the second Open Drive Down of the week on Thursday resuming the downside probe as it left as selling tail from 10845 to 10790 and made new lows for the month as it tagged 10670 but closed off the lows and at the dPOC leaving a ‘b’ shape profile which was not the ideal close for a initiative move happening from a large composite. Nifty then gave a gap up opening on Friday but was also an OH start at 10746 after which it probed lower testing the yPOC while making a low of 10691 in the ‘A’ period and made similar lows in the ‘B’ period again indicating exhaustion which added up to the ‘b’ profile of previous day confirming that the move to the downside is failing and ‘from failed moves we get big & fast moves‘ which is what happened as the ‘D’ period gave a huge rise of more than 330 points leaving an extension handle at 10746 as it made new highs for the week and in the process confirmed a FA (Failed Auction) on the monthly time frame at 10670. The auction continued the stellar move upside as it made new highs for the month and went on to tag the weekly VPOC of 11192 and after which it hit the 1 ATR objective of 11291 from the monthly FA all in just three hours. NF continued to rise making a high of 11382 in the ‘K’ period where it finally saw some profit booking as it left a small tail at top and closed at 11274 leaving the biggest daily range of 691 points in the last 10 years falling just short of the all time high of 711 points it had recorded on 18th May 2009. The weekly profile which was developing as a Triple Distribution profile down till Friday now has an extension handle at 11073 along with a buying tail till 11152 which will be an important reference in the coming week(s). The weekly Value was however much lower at 10682-10832-11012.
Weekly Hypos for Nifty (Spot):
A) Nifty needs to sustain above 11290 for a move to 11343-350 & 11396
B) Immediate support is 11236 below which the auction could test 11187-184 & 11151-131
C) Above 11396, Nifty can probe higher to 11440-449 & 11499-503
D) Below 11131, lower levels of 11078-73 & 11025-04 could come into play
E) If 11503 is taken out & sustained, Nifty can have a fresh leg up to 11535 / 11557-571 & 11611-625
F) Break of 11004 could bring lower levels of 10973-967 / 10921 & 10886-869
G) Sustaining above 11625, the auction can tag higher levels of 11664-678 / 11707-719 & 11735
H) Staying below 10869, Nifty can probe down to 10845-816 / 10765-745 & 11713-708
NF (Weekly Profile)
11295 [11406 / 10705]
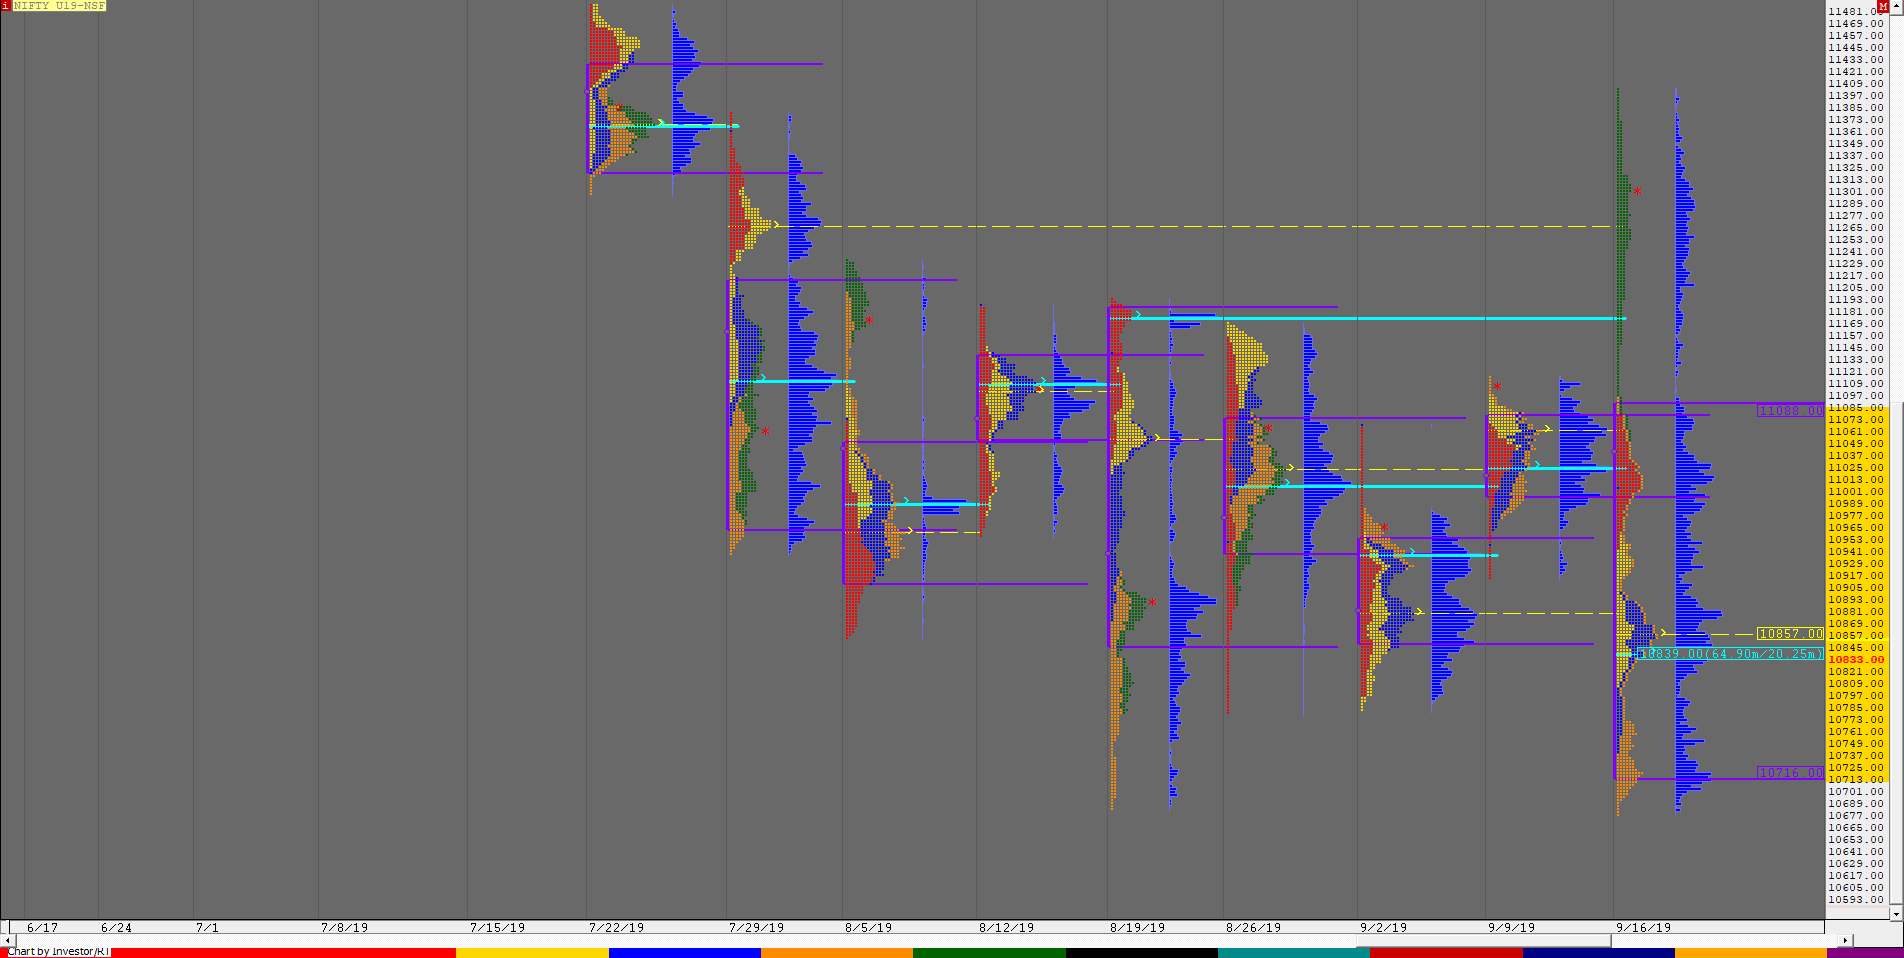
NF rejected the previous week’s spike close of 11075 to 11118 on Monday as it opened with a gap down indicating that the PLR is to the downside and probed lower leaving a Trend Day Down on Tuesday as it made lows of 10808 after which it made an inside bar on Wednesday as the imbalance turned into a balance. Thursday saw another trending move lower as auction changed from balance to imbalance as NF made new lows for the series at 10678 to leave a ‘b’ shape profile for the day and a Triple Distribution Down profile for the week. NF however overturned the entire scenario on Friday as it opened higher & took support at the yPOC of 10706 and went on to make a massive move to the upside of 700 points and in the process left a weekly extension handle at 11079 as it went on to make highs of 11406 leaving an elongated weekly profile with a close at 11295 though the Value was much lower at 10716-10857-11088. The small tail at top from 11373 to 11406 would be the resistance in the coming week with immediate support at the PBL of 11254 & HVN of 11210.
BankNifty Spot Weekly Profile (16th to 20th September)
28099 [ 28127 / 26993 ]
Last week report ended with this ‘On the downside, immediate support below 28045 is at 27960 below which the auction would turn weak.’‘
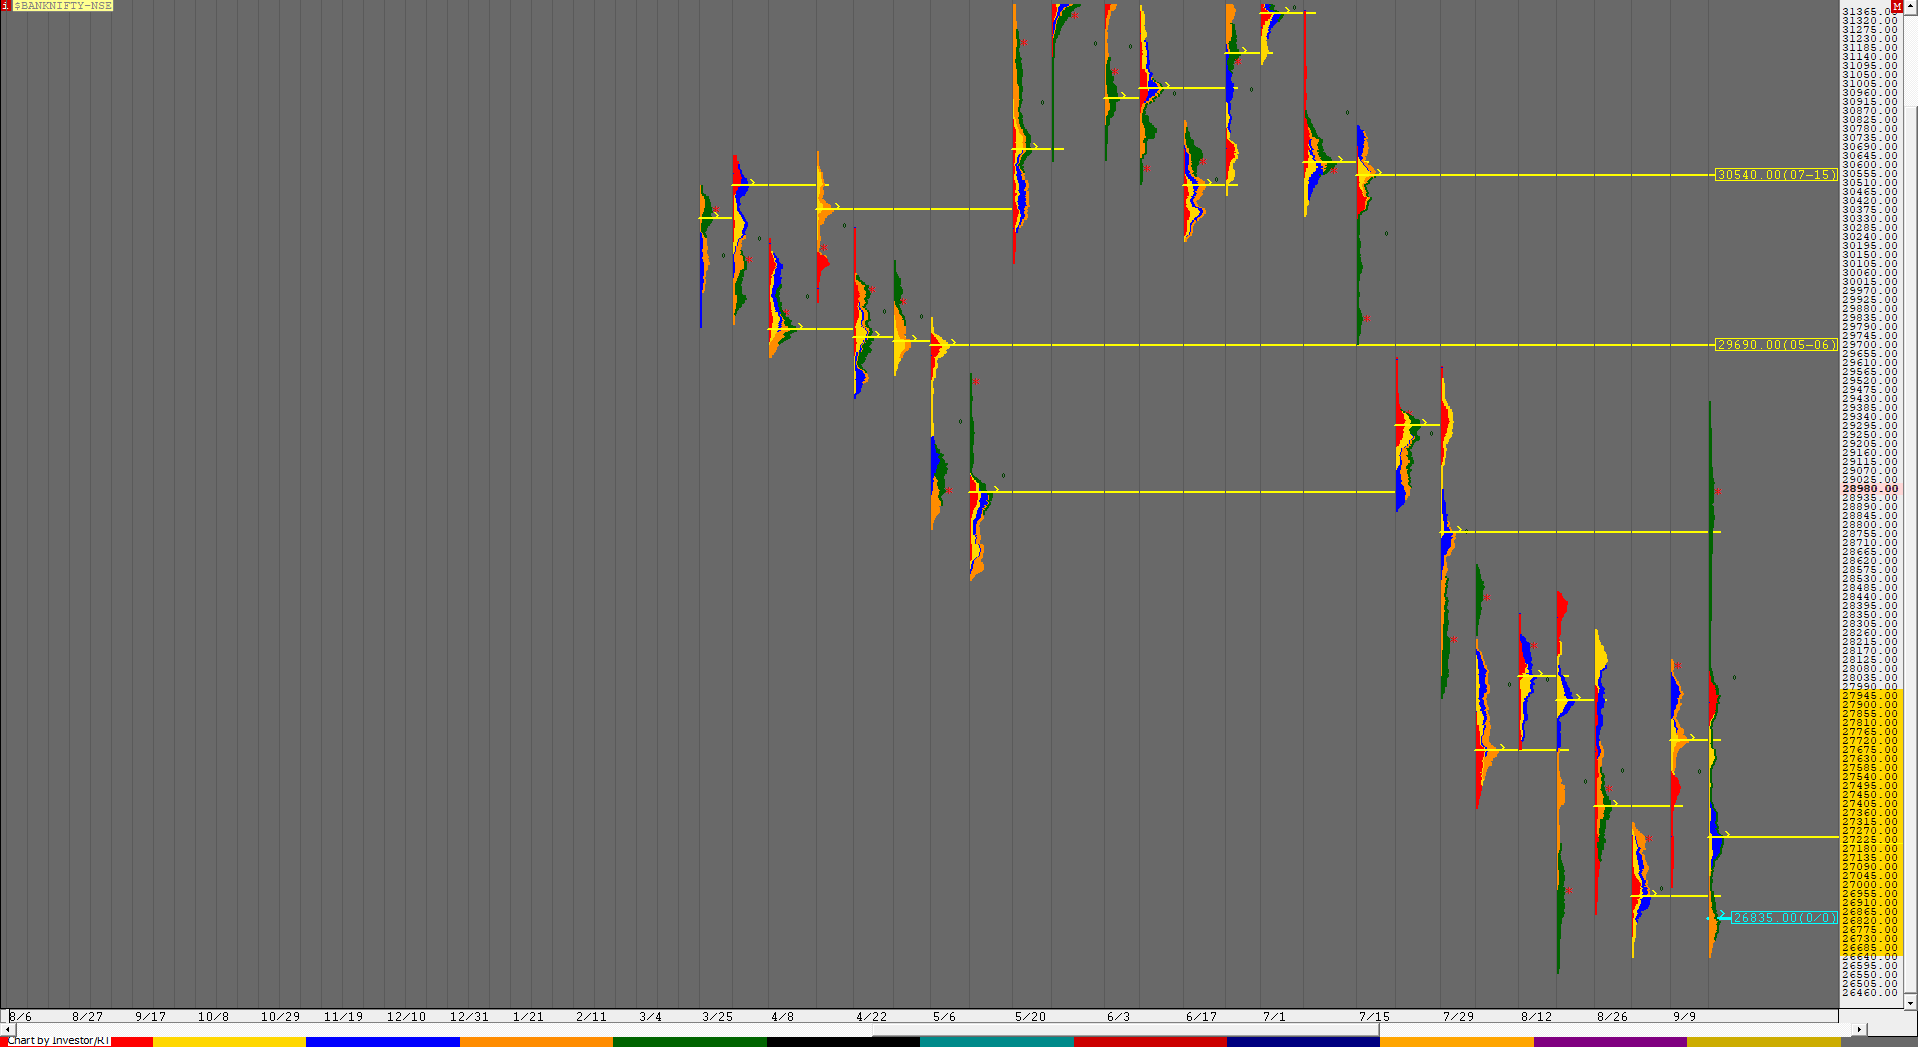
BankNifty opened with a big gap down of 270 points on Monday breaking below the above support levels and went down further by another 100 points as it made a low of 27798 in the opening 30 minutes from where it reversed the auction to probe higher & almost closed the gap as it made a high of 28067 but got rejected from above the weekly VAH finding no demand as it closed with the narrowest daily range in 2 months of 268 points indicating that it is getting ready for a range expansion. BankNifty then opened lower on Tuesday & broke below the PDL (Previous Day Low) to give a big 800 point move lower as it made lows of 27048 leaving a Trend Day Down to close around the lows. Wednesday then saw a balance as the auction stayed inside the IB range all day to leave an inside bar on the daily to give the second Gaussian profile of the week after which it gave a Open Drive down on Thursday with an OH start at 27175 to resume the weekly trend which was to the downside as it made new lows for the week at 26643 almost tagging the monthly low of 26641 but ended the day with a ‘b’ shape profile with the close just above the POC of 26729. The auction then opened a bit higher on Friday and dipped to test the yPOC making a low of 26727 where it was swiftly rejected and this indicated that the sellers were no longer in control and more confirmation came in the ‘C’ period which made a RE (Range Extension) to the upside. BankNifty then made an unprecented move of 1050 points in the D period as it left an extension handle at 27025 and engulfed the entire week’s range as it made new highs of 28075 along with a buying tail from 27025 to 27960. BankNifty continued to rise as it left a weekly extension handle at 28066 and went on to tag the weekly vPOC of 28755 after which it took a breather before making the final move of the day which saw it tagging highs of 29418 as it tagged the weekly HVN of 29355 making the biggest daily range ever of 2691 points as the weekly profile scaled above the previous 6 weeks auction which has made the structure completely bullish. BankNifty closed the week at 28981 leaving a small tail at top from 29282 to 29418 and completely away from the Value it formed which is at 26685-27225-27945 and has immediate support at 28835 & 28515 in the coming week.
Weekly Hypos for Bank Nifty (Spot):
A) BankNifty needs to sustain above 28970 for a move to 29071-90 / 29156 & 29241
B) Staying below 28970, the auction can test 28900 / 28835-815 & 28730
C) Above 29241, BankNifty can probe higher to 29282-327 / 29415-420 & 29505-535
D) Below 28730, lower levels of 28660-645 / 28560-515 & 28475 could come into play
E) If 29535 is taken out, BankNifty could rise to 29585 / 29635-670 & 29757-770
F) Break of 28475 could trigger a move lower to 28400-390 / 28327-309 & 28240-225
G) Sustaining above 29770, the auction can tag higher levels of 29836-845 / 29880 & 29930-950
H) Staying below 28225, BankNifty can probe down to 28141-125 / 28075-57 & 27984-945
Additional Hypos (Upside)
I) Above 29950, higher references in BN are 30016-26 / 30113-151 & 30190-220
J) Accpetance above 30220 could trigger a new leg up to 30277 / 30322-335 & 30370
K) If 30370 is taken out, the auction could rise further to 30443-451 / 30520-538 & 30585
BNF (Weekly Profile)
28990 [ 29425 / 26750 ]
BNF opened the week with a gap down and probed lower for the first 4 days which included a Trend Day Down on Tuesday after which it made a lows of 26683 on Thursday in the process forming a Triple Distribution weekly profile down but the Friday’s auction of 2674 points completely changed the weekly outlook as BNF left a weekly extension handle at 28095 and went on to make the biggest daily range to tag highs of 29425 before it closed the week at 28990. The weekly Value was lower at 26712-27272-28024.


