Nifty Spot Weekly Profile (18th to 22nd November)
Spot Weekly 11914 [ 12038 / 11867 ]
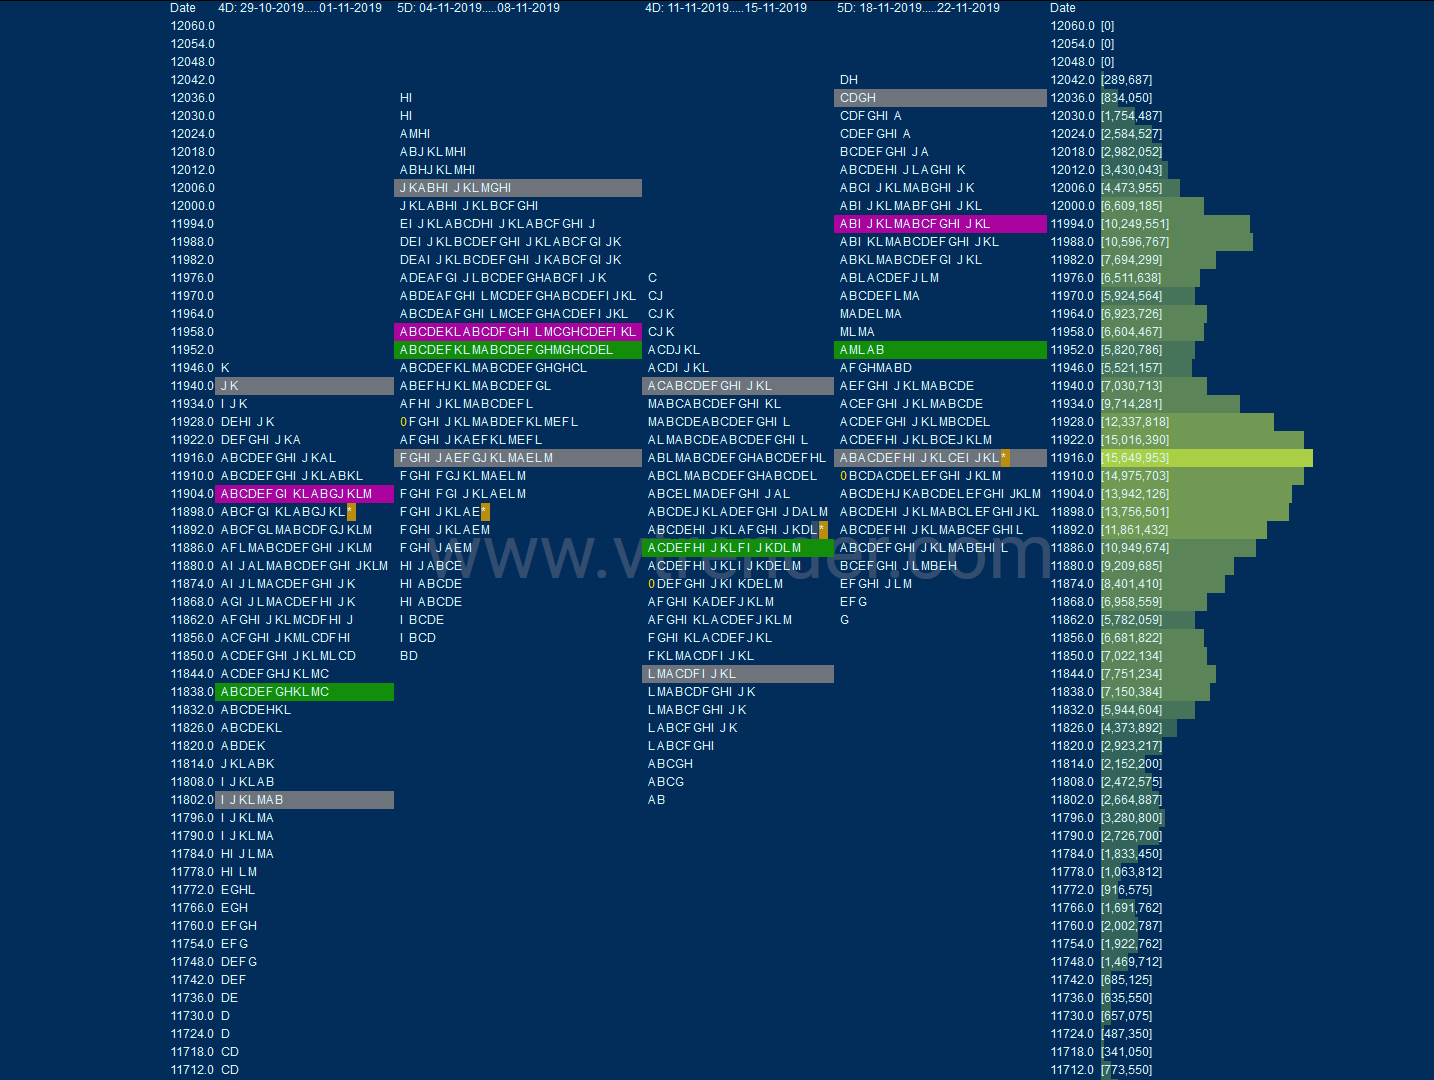
Nifty started the week implementing the 80% Rule in previous week’s Value as it got rejected from 11946 at open on Monday and probed lower to tag 11867 taking support just above the weekly VAL before closing at 11884. It remained in the same zone for most part of the day on Tuesday forming an inside day but spiked into the close as the auction made new highs for the week at 11959. This spike got accepted the next day as Nifty opened with a big gap up at 12004 and probed lower post the open which got stalled in the spike zone after which it went on to make a Range Extension to the upside getting above the weekly swing high of 12034 as it tagged 12038 but looked exhausted as it left poor highs leaving a Gaussian profile for the day. Thursday saw a mini ORR (Open Rejection Reverse) inside an OAIR start as the auction left a small tail at top at open to make another narrow range balanced profile which stayed inside the previous day’s range for most of the day before closing in a spike lower and this imbalance continued on Friday as Nifty left another tail at open in the IB (Initial Balance) and probed lower getting back into previous week’s Value & went on to tag the POC of 11894 where it took support leaving poor lows at 11885-11883 before closing the week at 11914 leaving a hat-trick of narrow range weekly profiles with the range matching that of the previous week’s of just 171 points and Value for the week at 11913-11992-12035.
On an even higher time frame, it seems like the auction has completed this phase of Steidlmayer Distribution (you can read about this here) after it started a new IPM (Initial Price Movement) from the weekly FA of 11090 as it has formed a ‘p’ shaped profile on a 4-week composite (click here to view the profile chart) with the Value at 11855-11917-12004 and the close right at the POC and would need an initiative move away from here in the next week.
Weekly Hypos for Nifty (Spot):
A) Nifty needs to sustain above 11925-950 for a move to 11991-12004 / 12045 & 12103
B) Staying below 11910, auction could test 11881 / 11827 & 11772
C) Above 12103, Nifty can probe higher to 12156 & 12208-211
D) Below 11772, lower levels of 11719 & 11665 could come into play
E) If 12211 is taken out & sustained, Nifty can have a fresh leg up to 12240-265 & 66512320
F) Break of 11665 could bring lower levels of 11611-584* & 11525-503
NF (Weekly Profile)
11943 [12009 / 11825]
Previous week’s report ended with this ‘The composite has a prominent POC at 11901 from where we could get a move away in the coming week & the Composite Value is at 11889-11901-12003‘
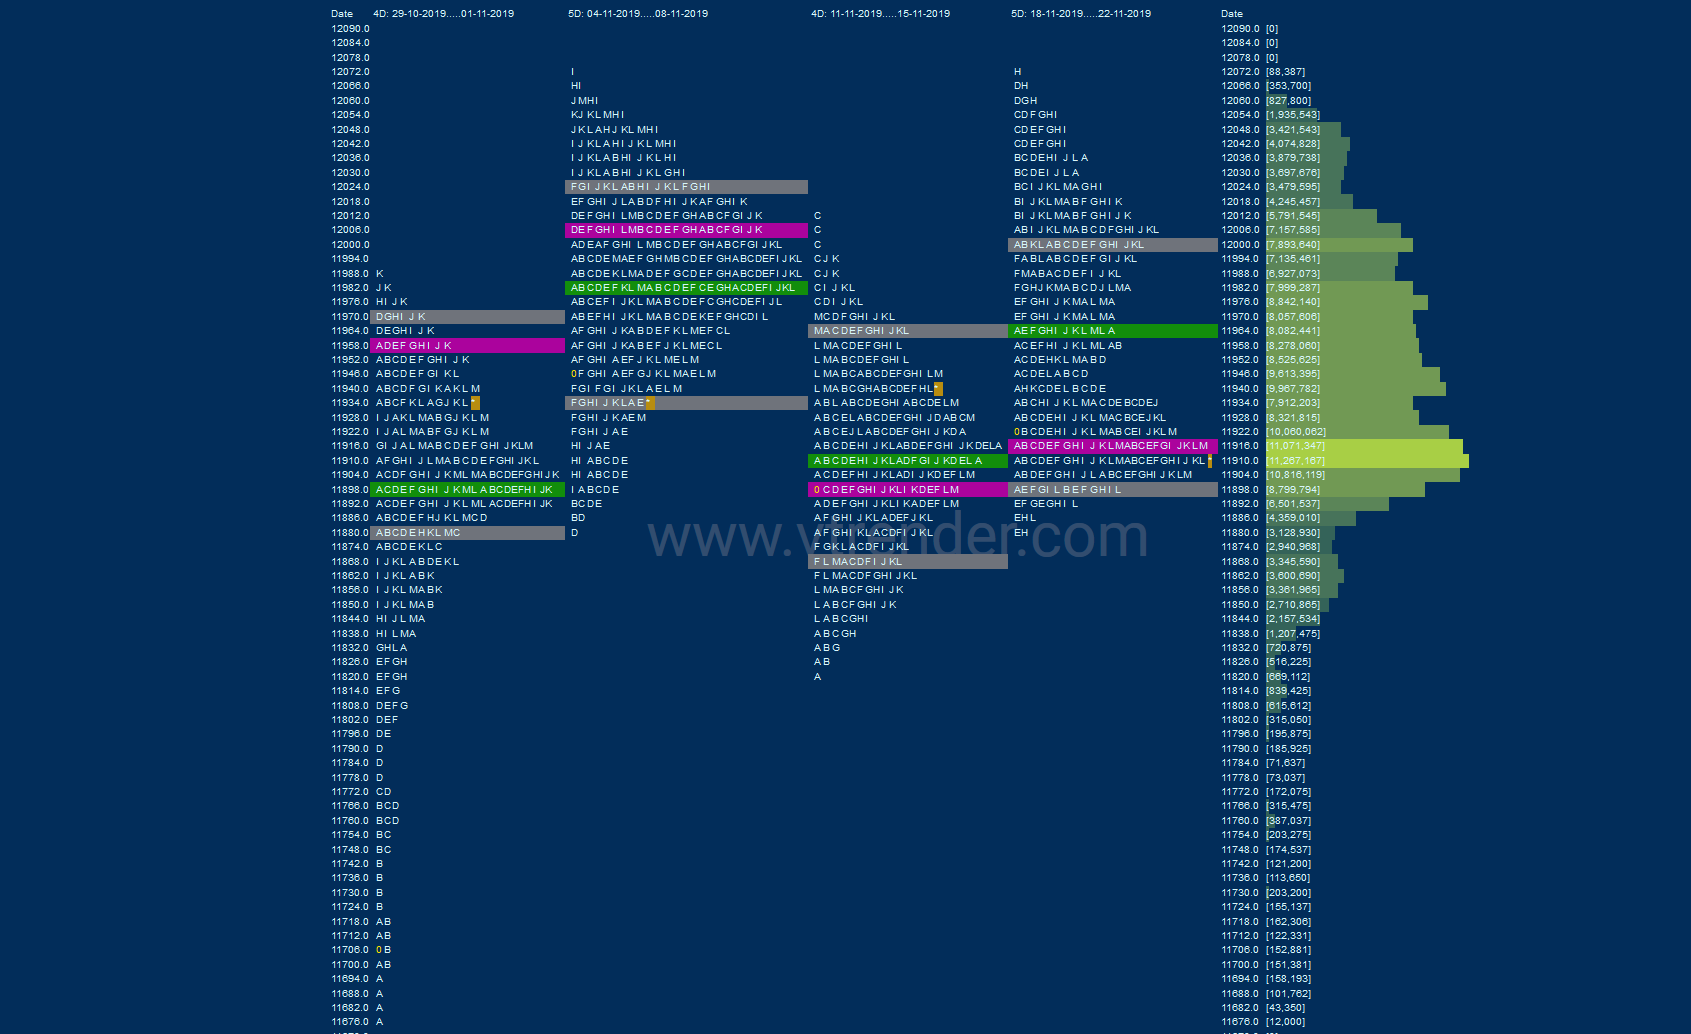
NF got rejected from the weekly VAH of 11958 at open on Monday after which it probed lower and even made a late RE (Range Extension) to the downside in the ‘E’ period but got stalled exactly at the VAL of the weekly composite mentioned above as it made a low of 11890 but could not sustain below the IBL ending the day with a nice balance & a ‘b’ shape profile with a prominent POC at 11918. The auction began the next day continuing to rotate around this POC in one of the lowest IB ranges of just 29 points as it made a low of 11901 which was the POC of the weekly composite (mentioned above) and this meant that the PLR was to the upside for a probe towards that composite VAH of 12003 and rightly so NF gave a RE to the upside in the ‘C’ period and went on to complete the 3 IB extension of 11988 to the dot forming a ‘p’ shape profile for the day leaving yet another prominent POC at 11960. This probe higher continued on Wednesday as NF took support just above 11960 and went on to tag the composite VAH of 12003 in the IB which was once again in a very narrow range of just 32 points and gave yet another C side RE higher and went on to make a high of 12066 stalling right below the previous highs for this series which was at 12069. The auction looked too much extended on the upside after back to back 3 IB extensions and rightly so there was a retracement in the second half of the day as NF made a pull back low of 11996 before closing the day at 12018 with the dPOC at 12044 and this was the first time in the week the close was below the dPOC signalling that the auction has changed hands with the sellers seem to be taking control after which the auction probed lower leaving an extension handle on Thursday at 11982 in the form of a spike lower which got accepted on Friday as NF got back into the weekly Value breaking below 11958 and promptly completing the 80% Rule once more as it made marginally new lows for the week at 11884 before closing at the prominent weekly POC of 11916. Value for the week was overlapping to higher at 11898-11916-11994 and like in Nifty, the NF also has formed a smooth ‘p’ shape profile on the 4 week composite (which can be seen here) with Value at 11891-11918-12008 and would be interesting to see if it moves away from here in the expiry move or in the new series.
BankNifty Spot Weekly Profile (18th to 22nd November)
31111 [ 31471 / 30901 ]
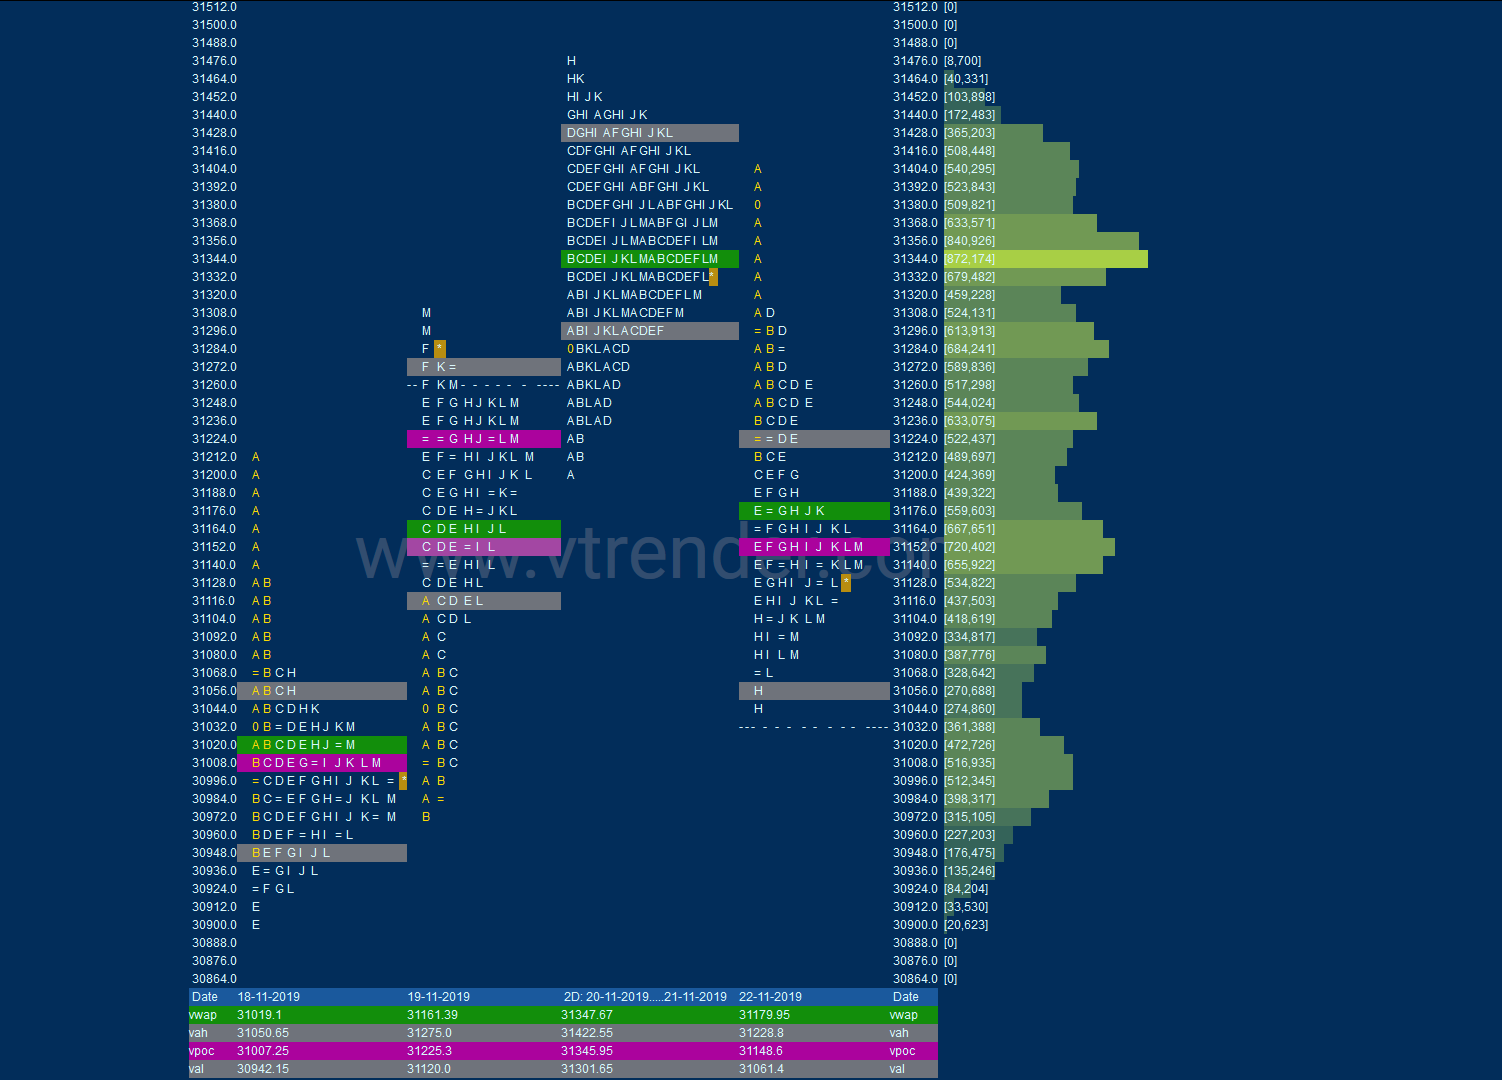
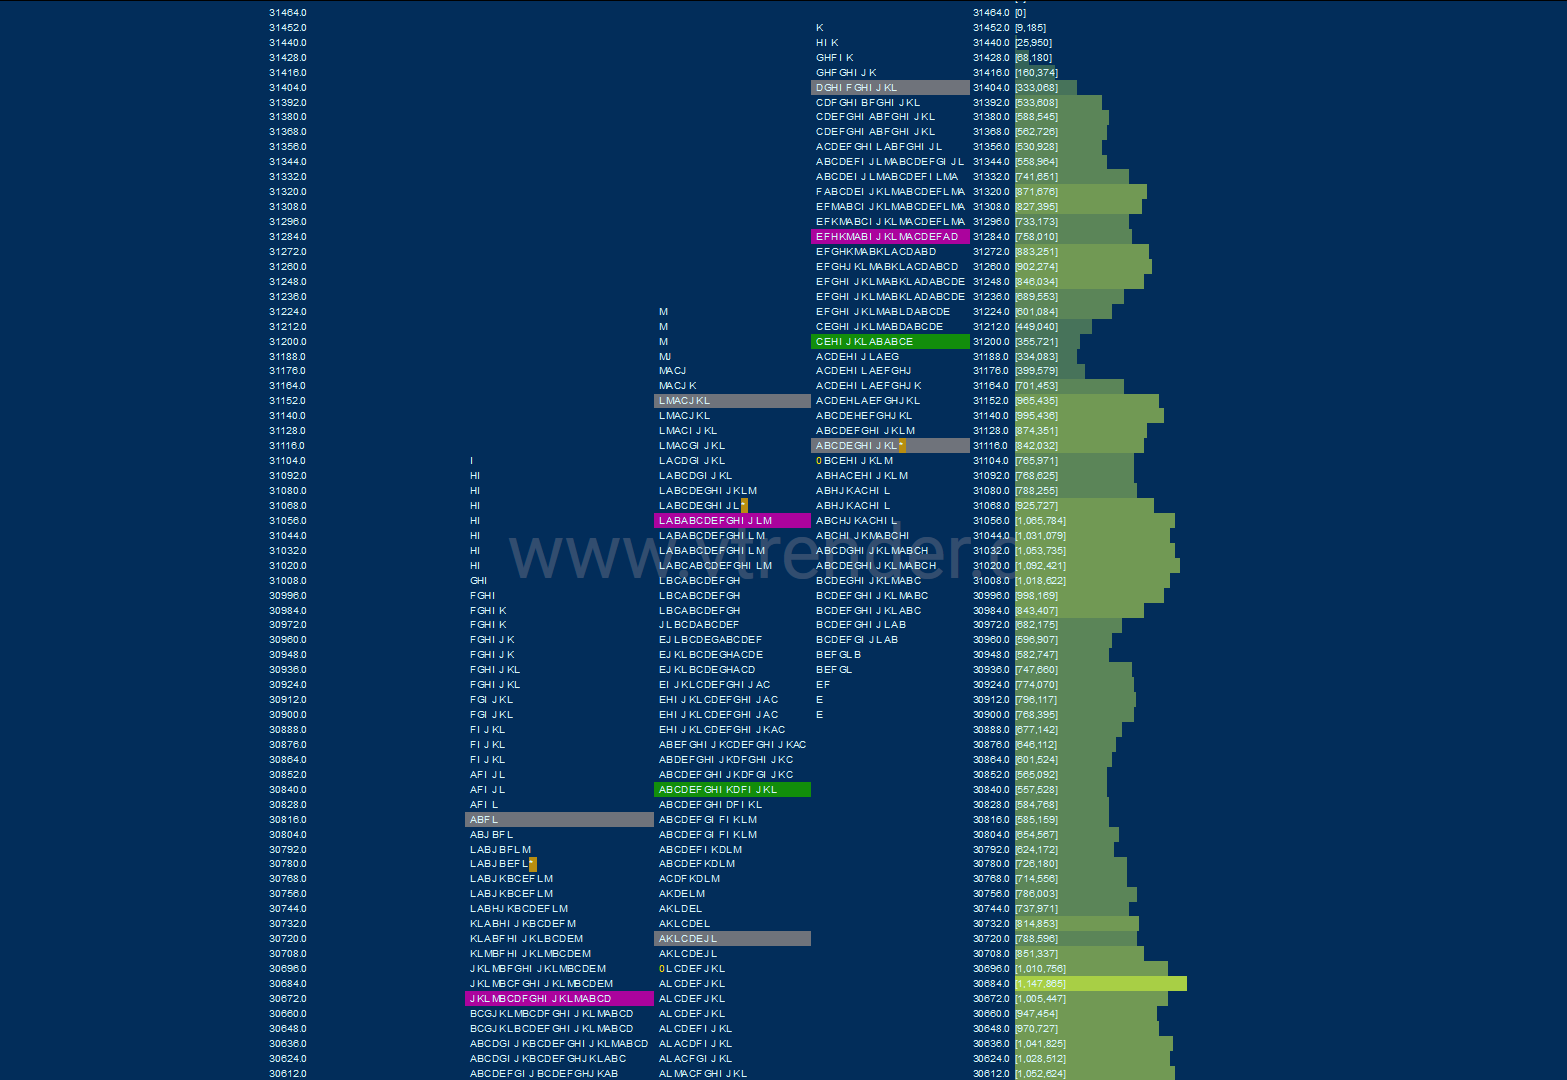
BankNifty opened the week at 31036 and probed higher but could not get above the previous week’s high as it made a high of 31203 in the ‘A’ period on Monday after which it reversed the auction to the downside for the day even making a RE lower but took support just above the weekly POC of 30880 as it made lows of 30901 forming a ‘b’ shape profile for the day which indicated that no new selling was coming in. The auction then probed higher for the next 2 days as it formed a ‘p’ shape profile on Tuesday where it got above previous week’s high to tag 31298 and continued to rise on Wednesday as it made mutiple REs higher to hit 31471 but left a small tail at top hinting that the imbalance could be ending. Thursday was an inside day with almost similar value forming a nice 2-day Gaussian profile which also confirmed a FA at day highs of 31463 which gave more confirmation that the probe could now be on the downside and not surprisingly BankNifty moved away from this balance on Friday morning as it left a selling tail from 31294 to 31394 in the IB and went on to almost complete the 1 ATR objective from the FA as it made lows of 31055 before closing the week at 31111. This week’s Value was mostly higher at 31118-31346-31423 but the close has been below the VAL so the PLR would be down for a test of 30880 below which it could fall further to the VPOC & 2ATR objective of 30626 from the FA of 31463. On the upside, the first reference would be 31150 above which the auction could tag the prominent POC of 31345.
Weekly Hypos for Bank Nifty (Spot):
A) BankNifty needs get above 31155 & sustain for a move to 31240 / 31300-345 & 31425
B) Immediate support is at 31065-50 below which the auction could test 31002 / 30953 & 30889-870
C) Above 31425, BankNifty can probe higher to 31505 / 31565-595 & 31685-708
D) Below 30870, lower levels of 30801 / 30750-713 & 30625* could come into play
E) If 31708 is taken out, BankNifty could rise to 31753-785 / 31853-865 & 31950
F) Break of 30625 could trigger a move lower to 30550-538 / 30450 & 30364-335
G) Sustaining above 31950, the auction can tag higher levels of 32025-40 / 32092 & 32125-137
H) Staying below 30277, BankNifty can probe down to 30204 / 30105-090 & 30015
I) Above 32137, BankNifty can probe higher to 32220-249 / 32316-347 & 32400-435
BNF (Weekly Profile)
31115 [ 31445 / 30900 ]
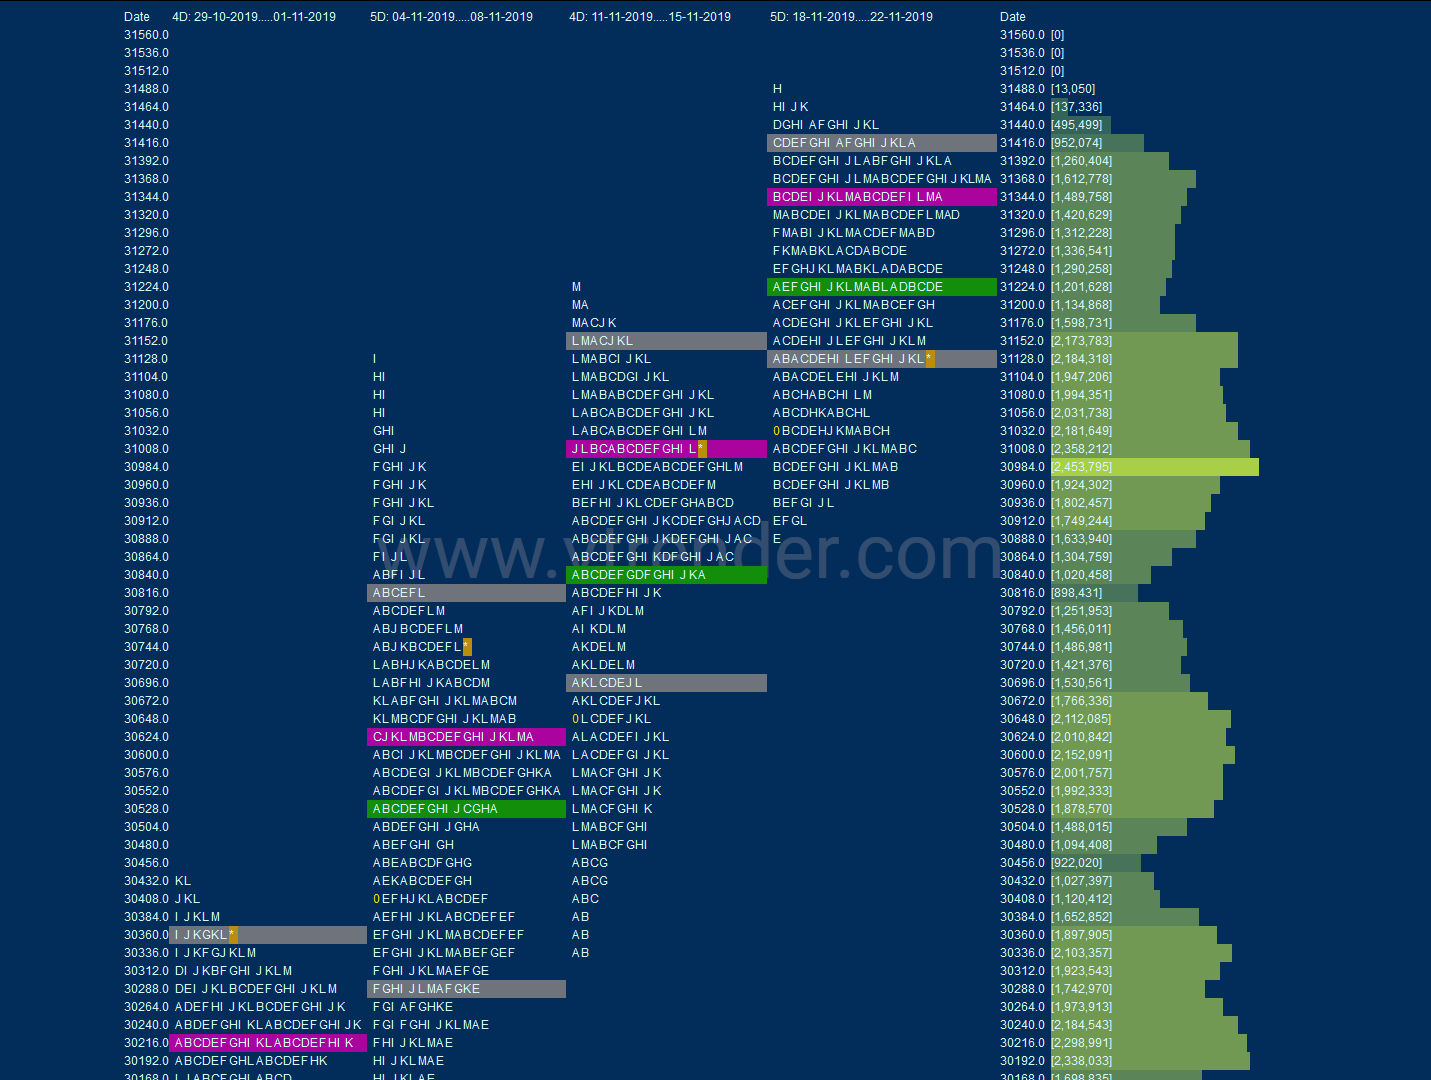
The weekly Value was mostly higher once again at 31114-31278-31402 but as in Spot, the close was around the VAL

