Nifty Spot Weekly Profile (25th to 29th November)
Spot Weekly 12056 [ 12159 / 11919 ]
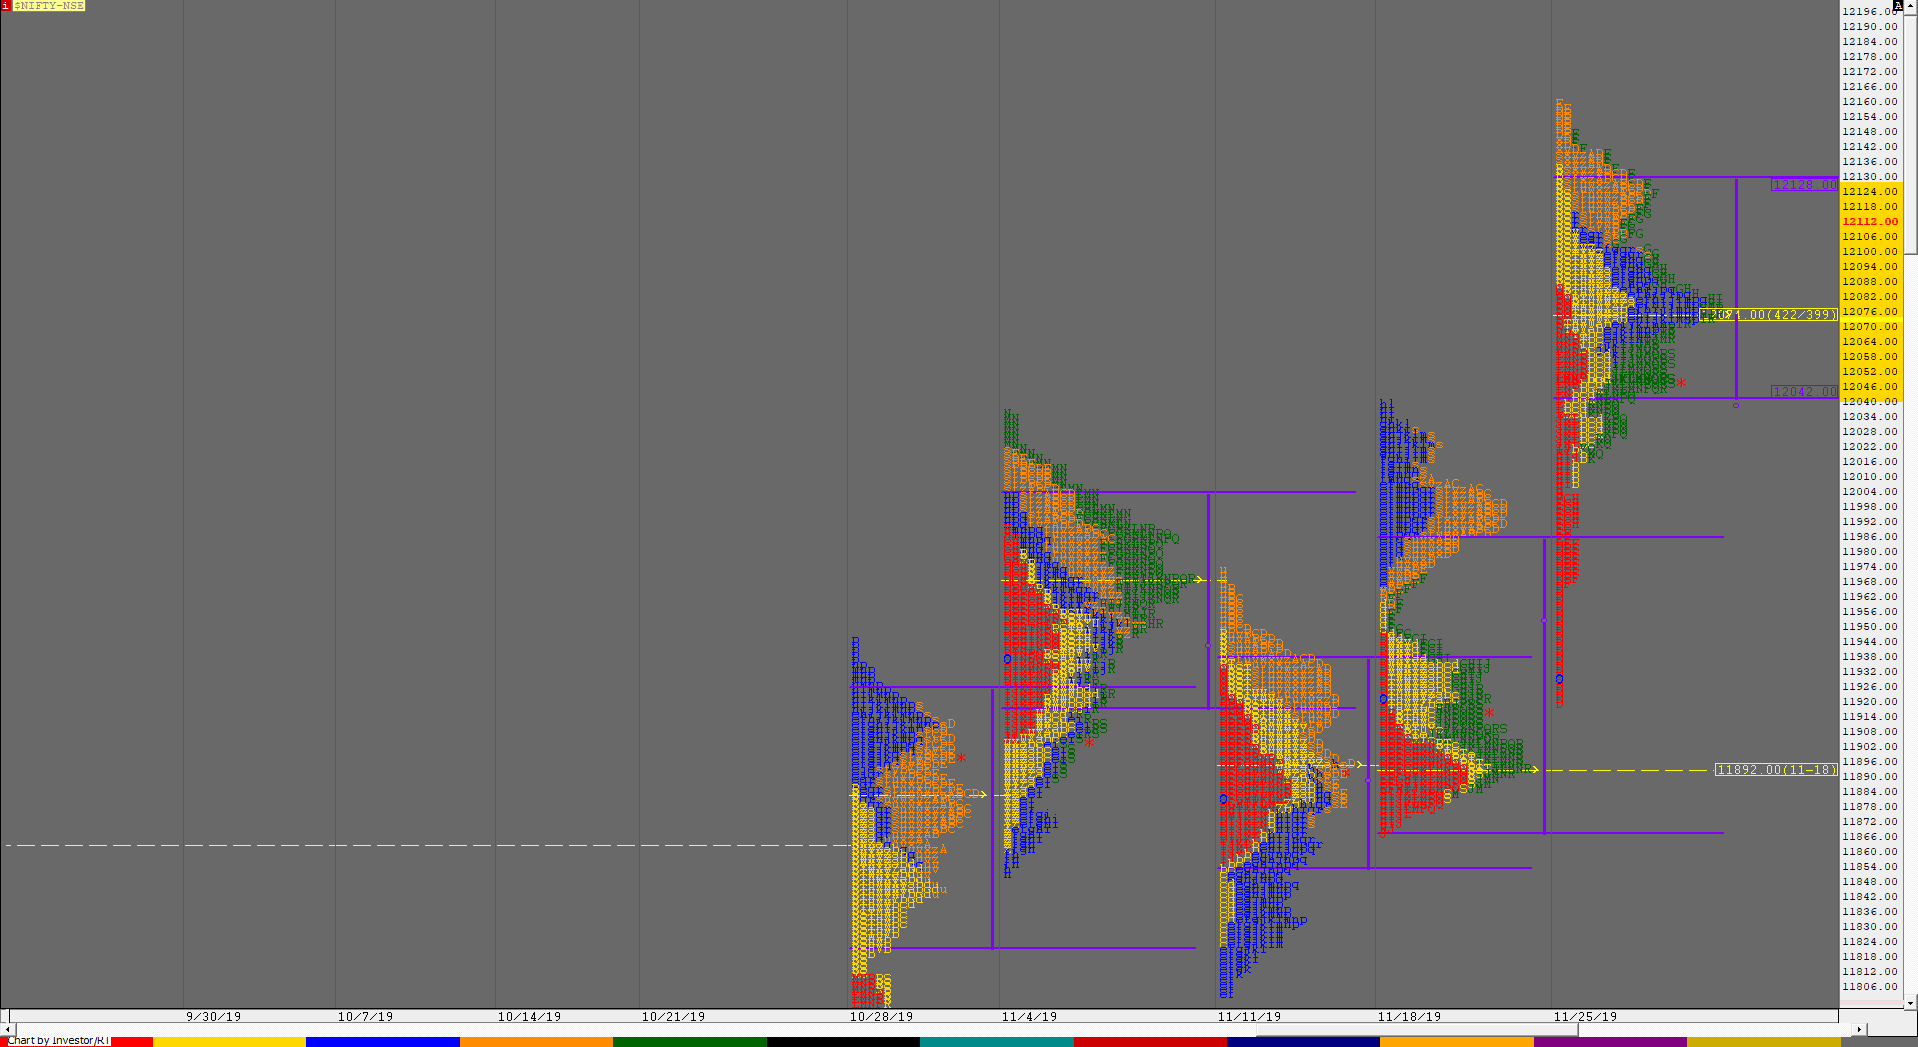
Previous week’s report ended with this ‘On an even higher time frame, it seems like the auction has completed this phase of Steidlmayer Distribution (you can read about this here) after it started a new IPM (Initial Price Movement) from the weekly FA of 11090 as it has formed a ‘p’ shaped profile on a 4-week composite (click here to view the profile chart) with the Value at 11855-11917-12004 and the close right at the POC and would need an initiative move away from here in the next week.’
Nifty opened the week with a drive away from the composite POC of 11917 as it left a Trend Day Up giving the biggest daily range of the month and in the process making new highs of 12084 on Monday. The auction opened with a gap up above all time highs on Tuesday as it tagged 12132 at open but was not able to extend the range further indicating that the current leg of imbalance was coming to an end as Nifty probed lower post IB making a retracement to 12006 taking support just above the weekly POC of 11992. Wednesday was a narrow range inside bar within a range of just 60 points which included a failed attempt to probe lower post IB which resulted in a Neutral Extreme Day as the auction made day highs at close and this closing imbalance continued on the next day with a small gap up as Nifty made new highs of 12138 in the IB but for the second consecutive day remained in a narrow range of around 45 points for most part of the day suggesting poor trade facilitation but closed with a mini spike to the upside while making new highs of 12159. This spike got rejected on Friday morning as the auction drove lower for the first half of the day completing the 2 IB move lower as it made lows of 12017 after which it started to form a balance leaving a ‘b’ shape profile for the day signalling long liquidation as it closed the day & week at 12056. The weekly profile however looks like a ‘p’ and has formed higher Value at 12024-12074-12128 with a prominent POC at 12074 which will be the reference to watch in the coming week for a move way in either direction.
Weekly Hypos for Nifty (Spot):
A) Nifty needs to sustain above 12065-74 for a move to 12113 / 12158 & 12208-211
B) Immediate support is at 12030-26 below which the auction could test 11978* & 11936-917*
C) Above 12211, Nifty can probe higher to 12240-265 / 12320 & 12377-380
D) Below 11917, lower levels of 11865 / 11811-802 & 11772 could come into play
E) If 12380 is taken out & sustained, Nifty can have a fresh leg up to 12433-465 & 12500
F) Break of 11772 could bring lower levels of 11719 / 11665 & 11611-584**
NF (Weekly Profile)
12100 [12196 / 11966]
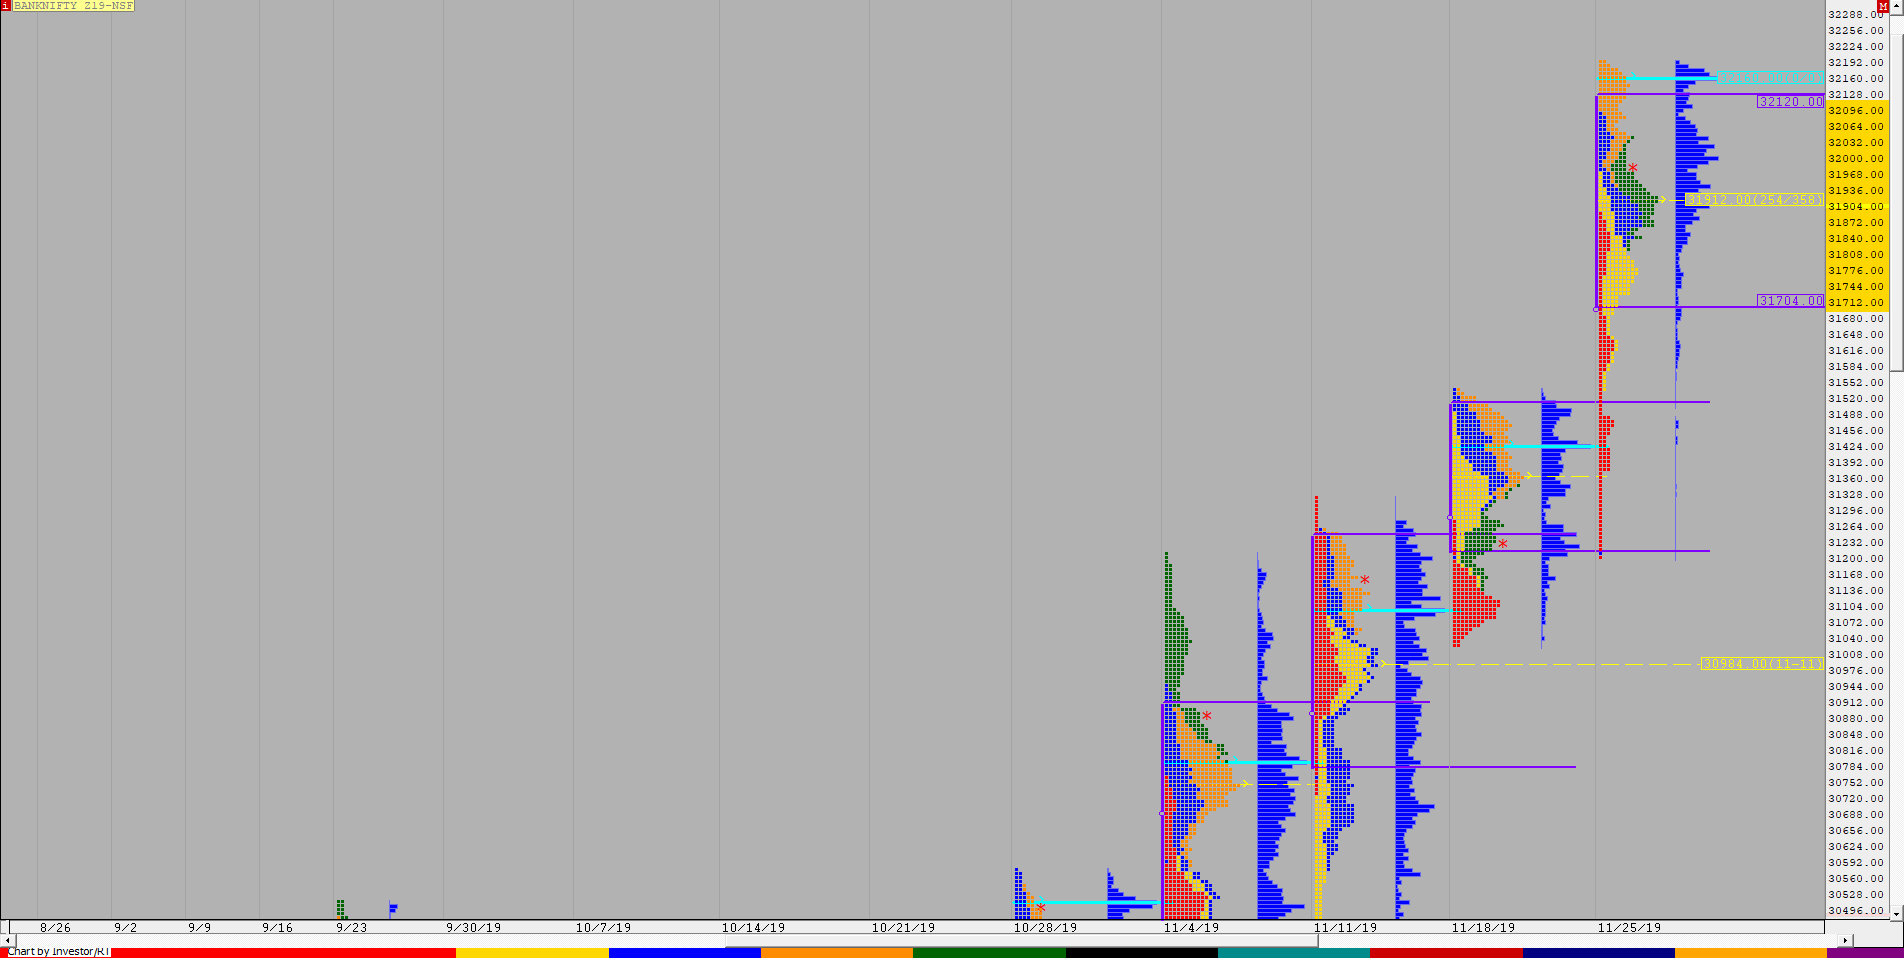
NF also has formed a ‘p’ shape profile after starting the week with a move away from the previous week’s prominent POC of 11955 and trending higher on Monday as it made highs of 12152 following it up with a new high of 12176 on Tuesday after which it consolidated making an inside day on Wednesday. The auction broke this inside bar to the upside on Thursday as it made new highs for the week at 12196 but in the process also left the narrowest daily range of just 54 points which indicated poor trade facilitation in this new zone and NF promptly gave a good probe lower on Friday after making the intention clear with an OH (Open=High) start at 12175 and a one time frame move down for the first half of the day as it made lows of 12051 before closing the week at 12100. This week’s profile has made higher Value at 12096-12141-12171 with a small low volume zone at 12090 to 12132 and a prominent POC at 12141 which will be the references on the upside for the coming week.
BankNifty Spot Weekly Profile (25th to 29th November)
31946 [ 32157 / 31049 ]
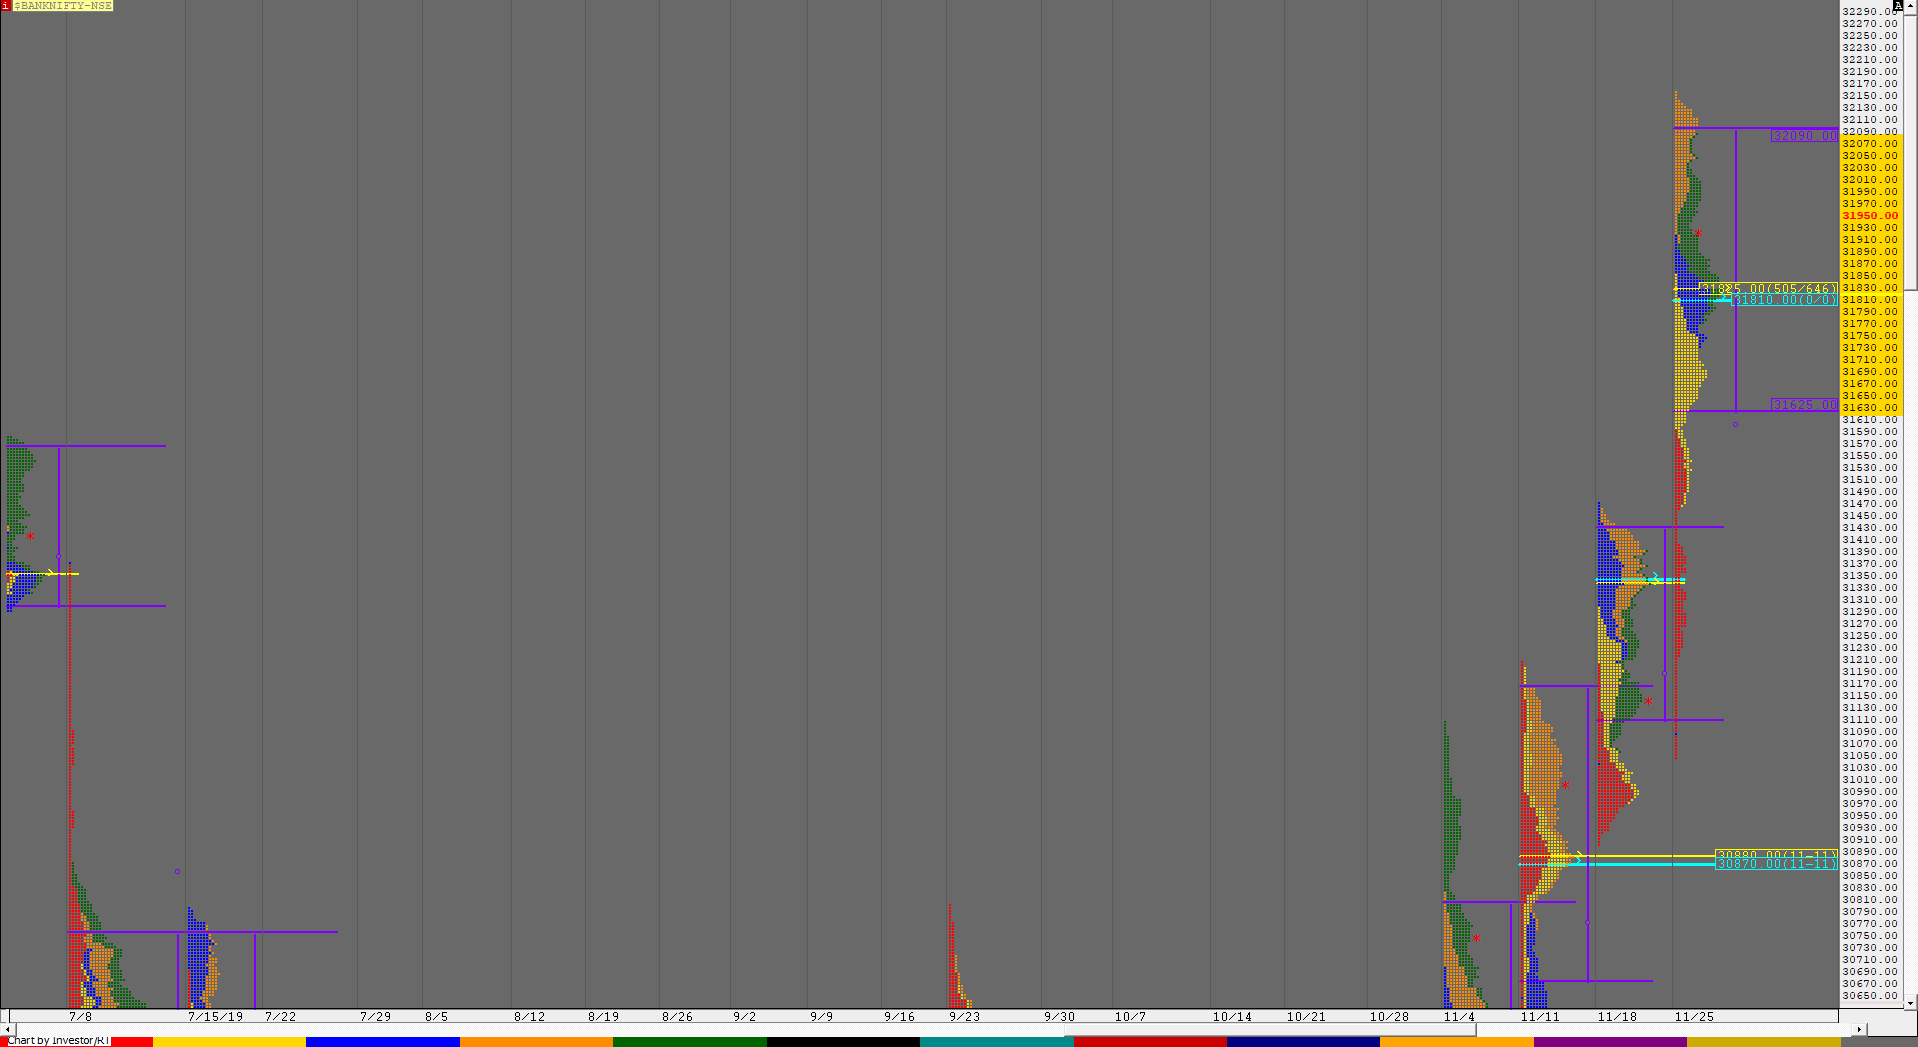
Previous week’s report ended with this ‘...the close has been below the VAL so the PLR would be down for a test of 30880 below which it could fall further to the VPOC & 2ATR objective of 30626 from the FA of 31463. On the upside, the first reference would be 31150 above which the auction could tag the prominent POC of 31345.’
BankNifty opened lower continuing the weakness but made an Open Drive up moving away from the first reference for this week which was at 31150 as it left a buying tail from 31215 to 31049 in the first hour which then led to a tag of that prominent POC of 31345 as the auction began to get accepted higher absorbing all the supply. Monday ended as a Double Distribution Trend Day as BankNifty left an extension handle around 31400 and went on to negate the weekly FA of 31463 as it scaled above previous week high to tag 31591. The auction continued the imbalance higher on Tuesday as it opened with a gap up & stayed above PDH to further extend the auction in IB as it made new All Time Highs of 31813 which marked the end of the imbalance as a balance began to form for most part of the day which ended with a big inventory adjustment move in the last hour as BankNifty first broke lower getting into the previous day’s range and made a low of 31466 stopping right above that negated weekly FA of previous week and the swift rejection saw BankNifty made new highs before close at 31850 and in the process confirmed a FA on the daily timeframe at 31466 which led to a new leg up as the auction continued the trend of making higher highs on the daily and in the process completed the 1 ATR objective of 31898 on Wednesday which was forming another balanced profile but ended up as a Neutral Extreme Day as once again the attempt to break lower was rejected and BankNifty confirmed another FA on the daily this time at 31734. Thursday open marked the hat-trick of Gap Ups as the auction drove higher and like all the days in the week made a RE to the upside riding on the latest FA and almost tagged the 1 ATR objective of 32168 as it made highs of 32157. The last day of the week however saw a change in the sequence as BankNifty opened lower and continued the probe down making a successful RE for the first time in the week to complete a 2 IB day down but recovered after making lows of 31770 to form a balanced profile but with lower Value on the daily time frame as it closed the week at 31946. The weekly profile is an elongated one with Value at 31625-31825-32090 and the PLR remains to the up for the coming week with immediate support at 31860-825.
Weekly Hypos for Bank Nifty (Spot):
A) BankNifty needs stay above 31955 & sustain for a move to 32005-42 / 32106 & 32165-168
B) Immediate support is at 31860-825 below which the auction could test 31770-734 & 31685-668*
C) Above 32168, BankNifty can probe higher to 32221 / 32310-330 & 32401
D) Below 31668, lower levels of 31595 / 31525-505 & 31465 could come into play
E) If 32401 is taken out, BankNifty could rise to 32490 & 32581-609
F) Break of 31465 could trigger a move lower to 31400-380 / 31330-301 & 31240-215
G) Sustaining above 32609, the auction can tag higher levels of 32671 & 32753-762
H) Staying below 31215, BankNifty can probe down to 31155-110 / 31065-50 & 31002
BNF (Weekly Profile)
32004 [ 32200 / 31178 ]
The weekly Value was mostly higher once again at 31704-31912-32120 with a HVN at 32160 which will need to be taken out on volumes for BNF to continue making higher value in the coming week(s).


