Nifty Spot: 21710 [ 21834 / 21500 ]
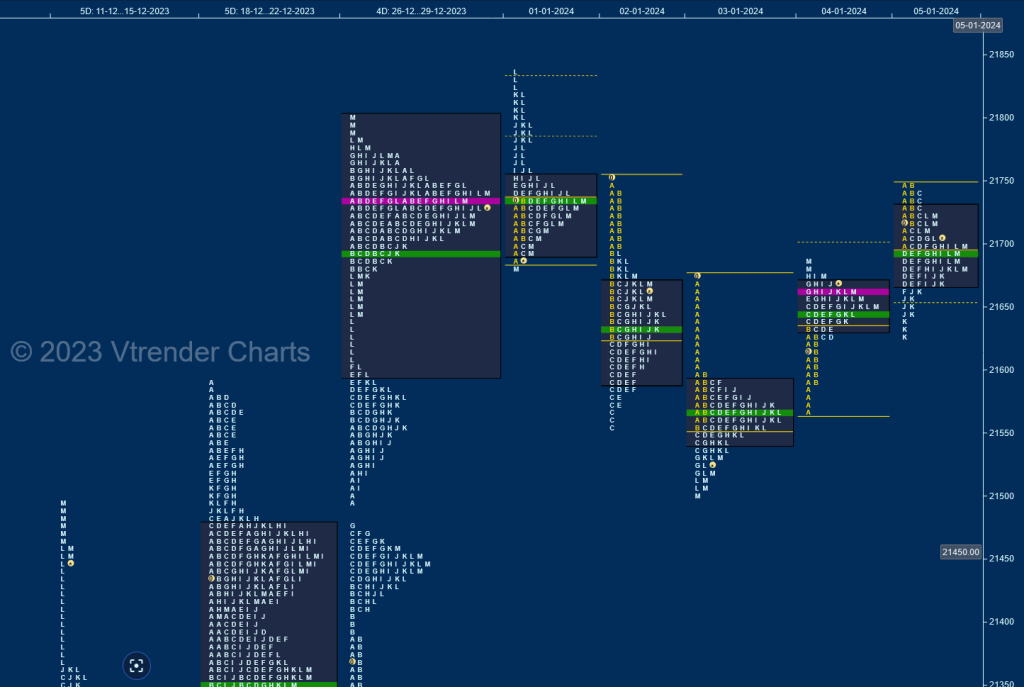
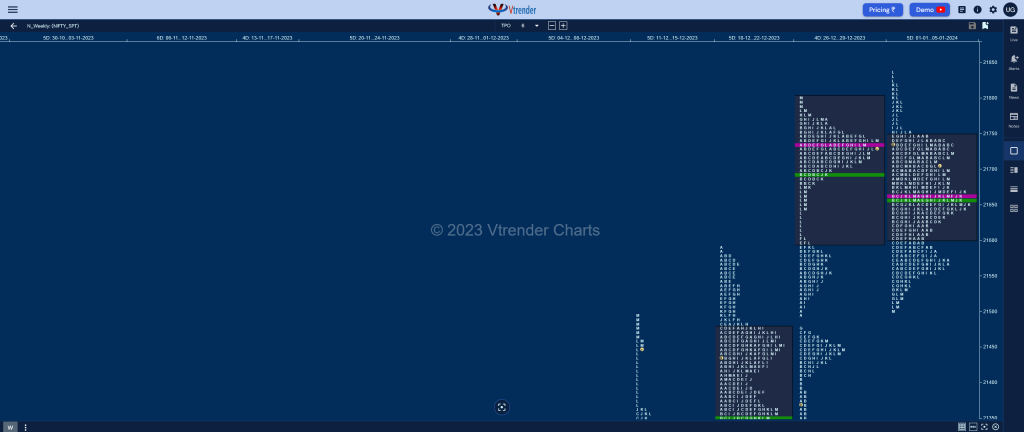
Previous week’s report ended with this ‘Nifty has formed a Triple Distriubtion Trend Up weekly profile with completely higher Value at 21599-21732-21800 which started with a zone of singles from 21350 to 21329 along with an extension handle at 21389 on 26th Dec where it left a prominent POC at 21445 and continued the upside imbalance with another zone of singles from 21505 to 21472 along with another wide POC at 21558 on the 27th which closed in a spike higher from 21603 to 21675 which form the third zone of singles for the week above which it carved a nice 2-day balance at the top leaving a small responsive selling tail from 21785 to 21801 and closing around the most prominent composite POC of 21732 which will be the opening reference for the first week of 2024‘

Nifty began the week with a probe higher scaling into previous week’s selling tail from 21785 to 21803 as it hit new ATH of 21834 but yet again left a responsive selling tail triggering a big drop of 334 points while making a low of 21500 taking support in the middle zone of last week’s profile from 21505 to 21472 forming a prominent daily POC at 21567 on 03rd Jan marking the end of the downside from where it gave a bounce back to 21749 at open on 05th. The weekly profile is a Neutral Centre One with completely inside Value at 21601-21663-21748 and can continue to remain in this range smoothening the balance further unless we get initiative activity at one end for a fresh imbalance to being either towards new ATH of 22000 plus on the upside or towards the daily VPOCs of 21445 & 21341 from 26th & 22nd Dec respectively on the downside in the coming week.

Click here to view this week’s MarketProfile of Nifty on Vtrender Charts
Hypos for 12th Jan 2024
| Up |
| 21661 – dPOC from 11 Jan 21714 – 6-day VAH (02-09 Jan) 21756 – 3-day VAH (28Dec-01-Jan) 21819 – Selling tail (01 Jan) 21857 – 1 ATR from yVAL (21675) |
| Down |
| 21630 – SOC from 11 Jan 21581 – Ext Handle (10 Jan) 21545 – Halfback (10 Jan) 21499 – VAL from 10 Jan 21445 – VPOC from 26 Dec |
BankNifty Spot: 48159 [ 48450 / 47481 ]
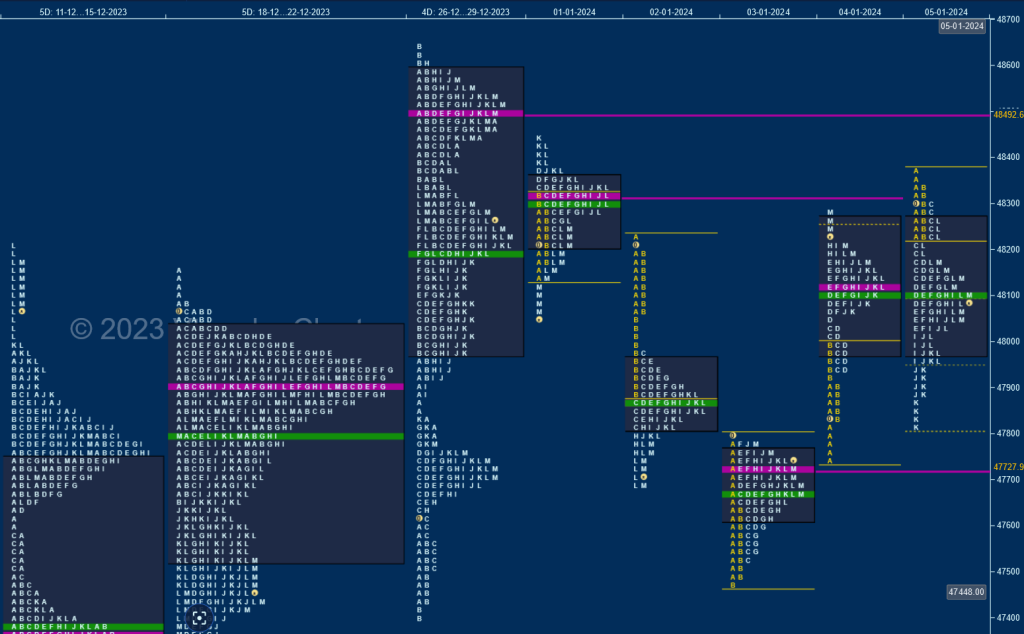
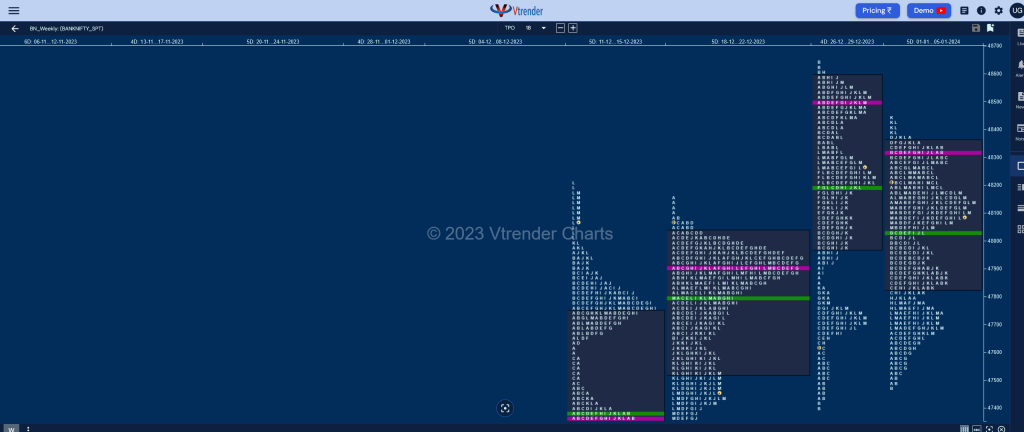
Previous week’s report ended with this ‘The weekly profile is a Trend Up one with mostly higher Value at 47976-48492-48592 with the POC shifting to the top confirming profit booking by the longs so will need fresh demand to come at or above 48492 in the coming week to resume the upside whereas on the downside, the 2 daily VPOCs of 48049 & 47710 along with the daily extension handle of 47838 would be the levels to watch for buyers coming back‘

BankNifty opened the week with a Neutral Day stalling just below previous week’s POC of 48492 as it made a high of 48450 marking the end of the upside and went on to probe lower tagging the daily VPOCs of 48049 and 47710 over the next 2 days and went on to make a low of 47481 on 03rd Jan holding just above the buy tail from 48446 to 47411 from 26th Dec but formed a narrow 317 point range Normal Day with a prominent POC at 47726 marking the lows for the week as it then gave a bounce back to 48281 with the help of a Double Distribution (DD) Trend Day Up on 04th stalling just below 01st Jan’s VPOC of 48312 which it tagged with a gap up open on 05th but left a small A period selling tail retracing the DD range while making a low of 47823 as it took support in the initiative buying tail leaving a 3-1-3 profile on the 2-day composite. The weekly profile is a Neutral Centre One with the range completely inside previous week as it formed Value below previous week’s POC of 48492 at 47835-48312-48361 with the immediate reference being the 2 opposite A period tails on the daily time frame which is 48344 to 48381 on the upside and 47823 to 47786 on the downside.

Click here to view this week’s MarketProfile of BankNifty on Vtrender Charts
Hypos for the week 12th Jan 2024
| Up |
| 47492 – dPOC from 11 Jan 47595 – Selling Tail (11 Jan) 47760 – SOC from 09 Jan 47924 – Ext Handle (08 Jan) 48082 – Selling Tail (08 Jan) |
| Down |
| 47408 – SOC from 11 Jan 47260 – Buy tail (11 Jan) 47126 – Buying Tail (10 Jan) 46974 -IB singles mid (21 Dec) 46831 – Weekly VPOC (04-08 Dec) |
