Nifty Spot: 21731 [ 21801 / 21329 ]
Previous week’s report ended with this ‘The weekly profile is a Neutral Centre one with completely higher Value at 21217-21342-21478 with a nice responsive buying tail at lows from 21036 to 20976 along with the daily FA of 21232 from 22nd Dec which will be the references on the downside for the coming week where as on the upside, Nifty will need to sustain above 21355 for a test of 20th Dec’s mid-profile zone of singles from 21414 to 21490 and above that the VPOC of 21574 along with the 2 ATR objective of 21599 from 21232 could come into play‘

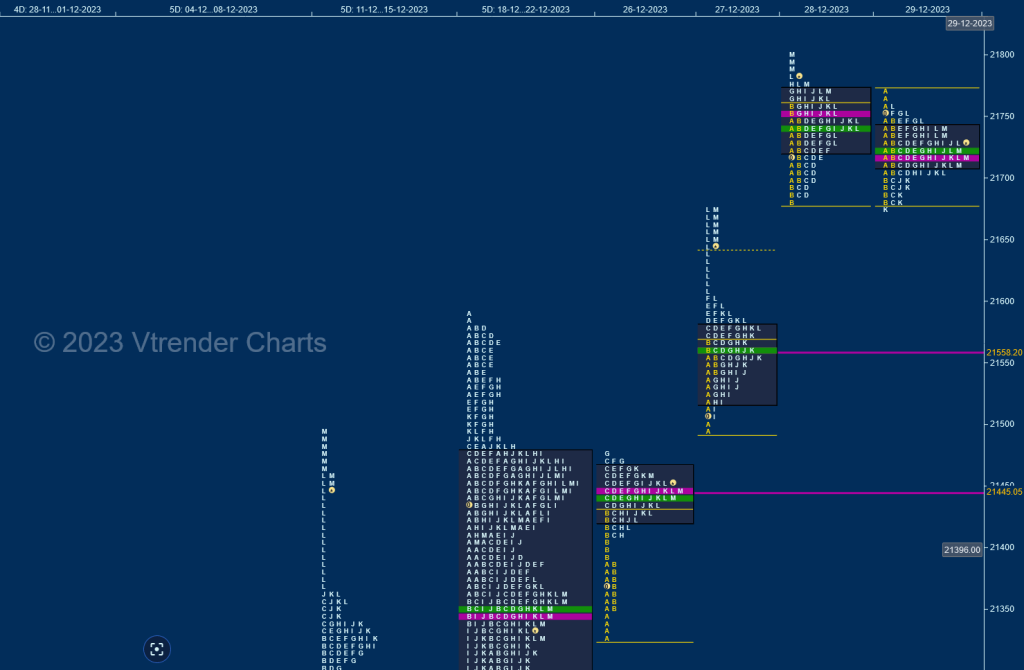
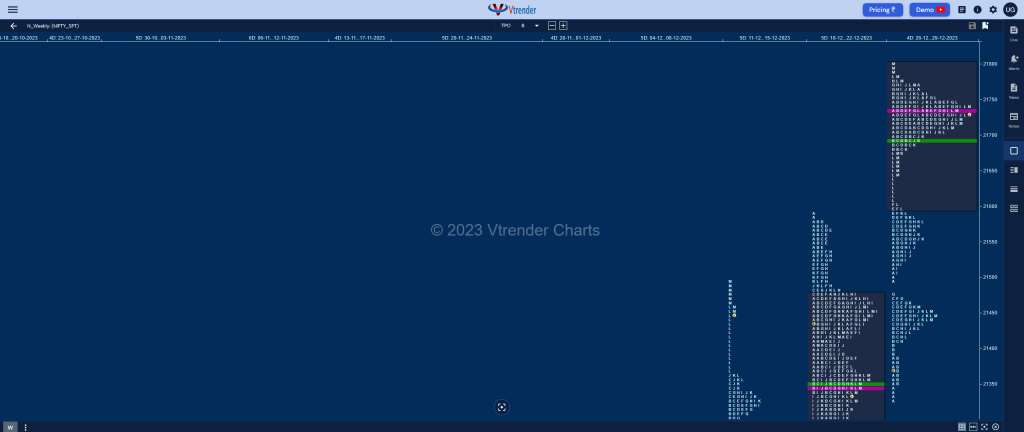
Nifty has formed a Triple Distriubtion Trend Up weekly profile with completely higher Value at 21599-21732-21800 which started with a zone of singles from 21350 to 21329 along with an extension handle at 21389 on 26th Dec where it left a prominent POC at 21445 and continued the upside imbalance with another zone of singles from 21505 to 21472 along with another wide POC at 21558 on the 27th which closed in a spike higher from 21603 to 21675 which form the third zone of singles for the week above which it carved a nice 2-day balance at the top leaving a small responsive selling tail from 21785 to 21801 and closing around the very prominent composite POC of 21732 which will be the opening reference for the first week of 2024.

Click here to view this week’s MarketProfile of Nifty on Vtrender Charts
Hypos for 05th Jan 2024
| Up |
| 21685 – Spike high (04 Jan) 21739 – Selling Tail (02 Jan) 21785 – SOC from 01 Jan 21819 – Selling tail (01 Jan) 21860 – 1 ATR from yVAH (21669) |
| Down |
| 21663 – dPOC from 04 Jan 21624 – Ext Handle (04 Jan) 21567 – dPOC from 03 Jan 21508 – Closing tail (03 Jan) 21445 – VPOC from 26 Dec |
BankNifty Spot: 48292 [ 48636 / 47411 ]
Previous week’s report ended with this ‘The weekly profile is a Neutral and a well balanced one with overlapping to higher Value at 47536-47915-48028 and has small tails at both ends indicating rejection and presence of 2 big OTF (Other Time Frame) players who have marked their respective zones and BankNifty could continue to remain in this range before one of the tails is taken out with this week’s prominent POC of 47915 acting as a magnet’

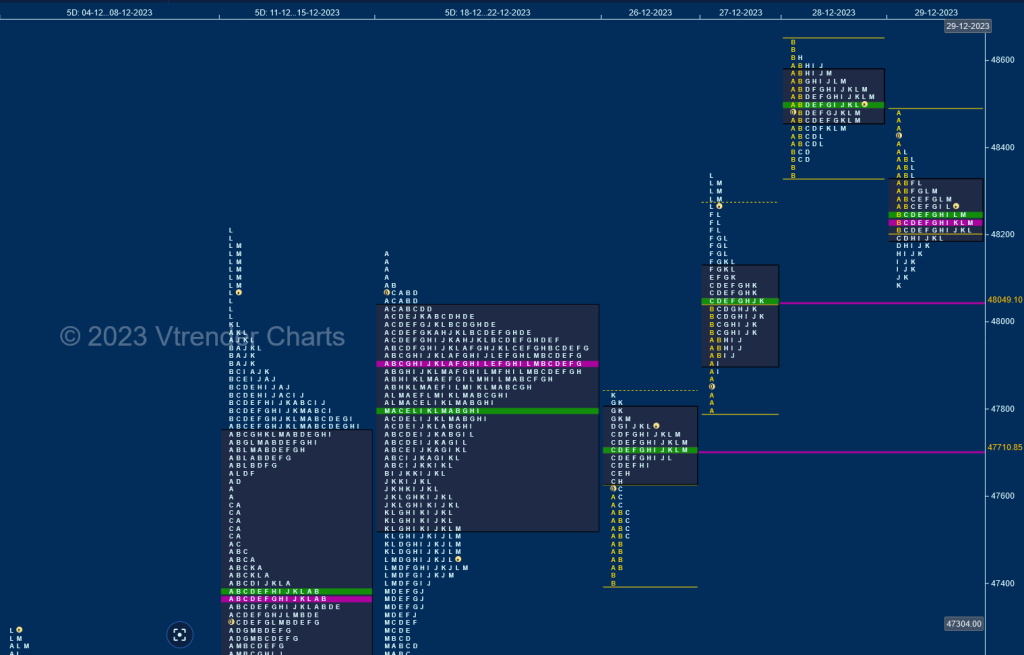
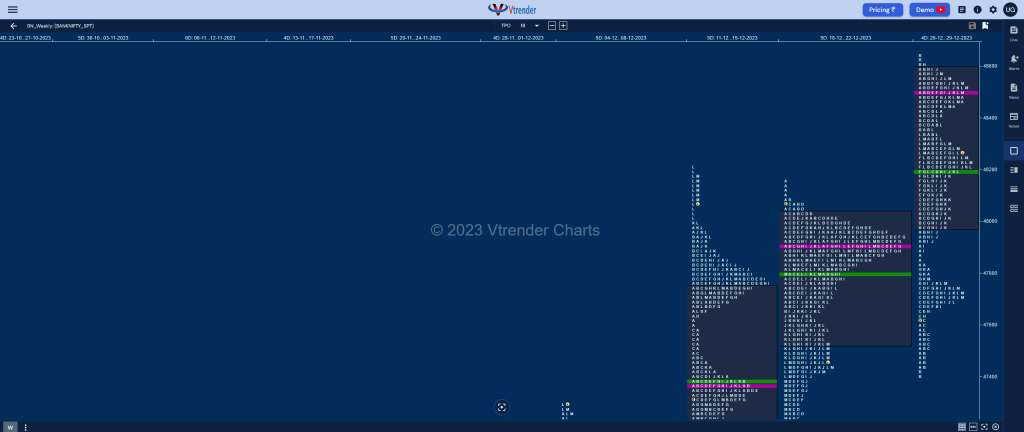
BankNifty started the week with a fill up of previous week’s structure with the help of a ‘p’ shape profile on 26th Dec consisting of a small buying tail from 47446 to 47411 along with an extension handle at 47624 forming a prominent POC at 47710 and made an initiative move to the upside on 27th with another initiative buying singles from 47884 to 47806 as it recorded new ATH of 48347. The auction continued the imbalance with a gap up open on 28th where it hit 48636 just falling short of the weekly 3 IB objective of 48643 marking the highs of the week forming a Normal Day with a prominent POC at 48492 and followed it with a long liquidation ‘b’ shape profile on 29th forming lower Value. The weekly profile is a Trend Up one with mostly higher Value at 47976-48492-48592 with the POC shifting to the top confirming profit booking by the longs so will need fresh demand to come at or above 48492 in the coming week to resume the upside whereas on the downside, the 2 daily VPOCs of 48049 & 47710 along with the daily extension handle of 47838 would be the levels to watch for buyers coming back.

Click here to view this week’s MarketProfile of BankNifty on Vtrender Charts
Hypos for the week 05th Jan 2024
| Up |
| 48275 – SOC from 01 Jan 48369 – SOC from 01 Jan 48492 – VPOC from 28 Dec 48614 – Selling tail (28 Dec) 48745 – 1 ATR (POC 48237) |
| Down |
| 48175 – Spike low (04 Jan) 48026 – Ext Handle (04 Jan) 47840 – Buying Tail (04 Jan) 47726 – VPOC from 03 Jan 47657 – Closing PBL (03 Jan) |
