Nifty Spot: 19794 [ 19875 / 19670 ]
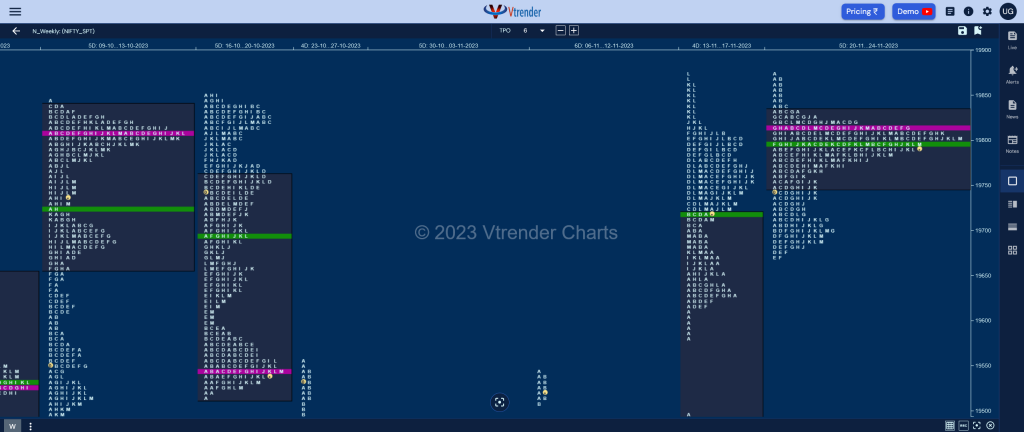
Previous week’s report closed with this ‘The weekly profile is an elongated 461 point range Double Distribution Trend Up one with mostly higher Value at 19415-19449-19718 and a zone of singles from 19479 to 19614 which Nifty could fill up in the coming week if it stays below Friday’s POC of 19762 whereas on the upside, we will need initiative buying activity at Thursday’s SOC of 19816 for a test of the weekly selling handles of 19885 & 20017 from the 18th to 22nd Sep profile‘

Monday – 19694 (19756 / 19670)
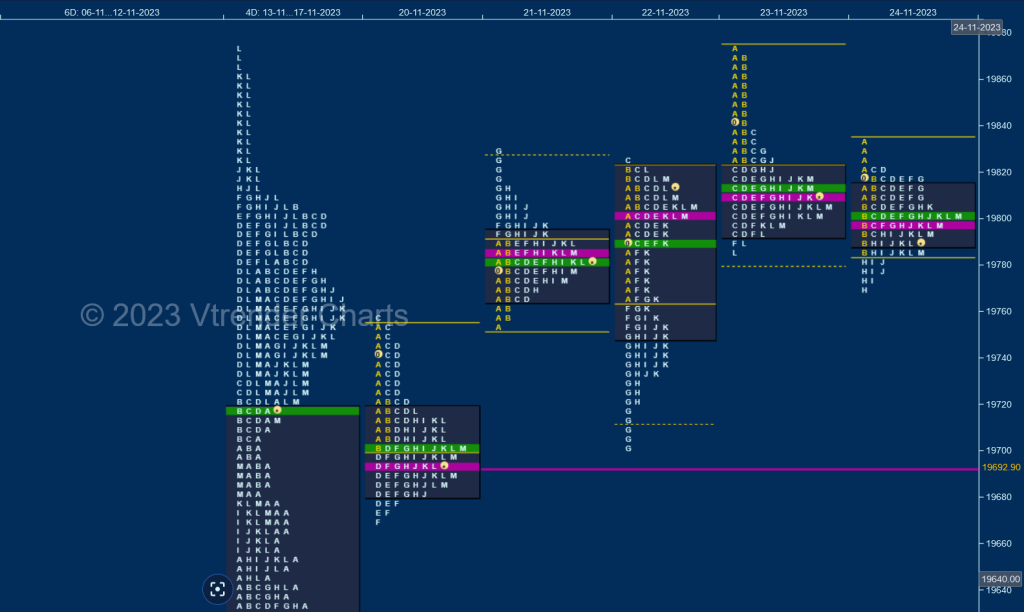
Nifty made an OAIR start forming a very narrow 51 point range IB between 19701 to 19752 after which it made the dreaded C side extension to 19756 which was swiftly rejected resulting in a FA being confirmed but the downside also looked limited as seen in similar lows of 19673 & 19670 indicating lack of supply closing the day right the prominent POC of 19693 leaving a Neutral Centre profile
Tuesday – 19783 (19829 / 19754)
The auction opened away from previous Value with the help of a gap up sustaining above Monday’s FA of 19756 and scaling above last Friday’s VPOC of 19762 while making a high of 19790 in the A period but settled down into an OAOR forming a mere 36 point range IB and remained inside it for most part of the day except for an attempt it made in the G TPO to extend higher but could only leave a small responsive selling tail from 19812 to 19829 leaving a Gaussian Curve for the day closing yet again at the prominent POC of 19784
Wednesday -19811 (19825 / 19703)
saw an OAIR start right at 19784 and yet another narrow 56 point range IB which took support right at Tuesday’s VAL of 19767 but for the second time in the week made a typical C side move to 19825 which was rejected triggering giving way to yet another FA at highs and this time it went on to complete the 1 ATR objective of 19713 while making a low of 19703 in the G period taking support just above Monday’s VPOC of 19693 as it left a small responsive buying tail till 19723 and retraced the entire fall bouncing back to 19822 into the close
Thursday – 19802 (19875 / 19786)
Nifty opened above the FA of 19825 and probed higher in the A period hitting 19875 but could not get above previous week’s highs which led to the B TPO doing a rebel retracing the upmove which was followed by a C side extension lower after which it remained all day inside the range of C forming a ‘b’ shape profile for the day with a prominent POC at 19809
Friday – 19794 (19832 / 19768)
The auction opened right at yPOC of 19809 and continied to remain in narrow range forming a mere 64 point Normal Day with mostly overlapping Value and building yet another prominent POC at 19800 completing a nice 4-day balance above Monday’s VPOC of 19693 with Value at 19778-19812-19819

The weekly profile is a narrow 205 point range Normal Variation one to the upside with completely higher Value at 19746-19812-19830 and will be looking for initiative activity at open in the coming week which can start a fresh imbalance in either direction with the daily VPOC of 19693 & last week’s zone of singles from 19614 to 19479 being the objectives on the downside whereas on the upside, NIfty will need to sustain above 19819 for a test of the weekly selling handles of 19885 & 20017 from the 18th to 22nd Sep profile
Click here to view this week’s MarketProfile of Nifty on Vtrender Charts
Hypos for the week 28th Nov to 01st Dec 2023
| Up |
| 19830 – Weekly VAH 19885 – Ext Handle (18-22 Sep) 19953 – VPOC from 20 Sep 20017 – Selling Tail (20 Sep) 20057 – Gap mid (20 Sep) 20114 – Closing PBH (14 Sep) |
| Down |
| 19746 – Weekly VAL 19693 – VPOC from 20 Nov 19630 – dPOC from 15 Nov 19547 – DD singles mid (13-17 Nov) 19494 – Ext Handle (15 Nov) 19449 – VPOC from 13 Nov |
BankNifty Spot: 43769 [ 43806 / 43230 ]
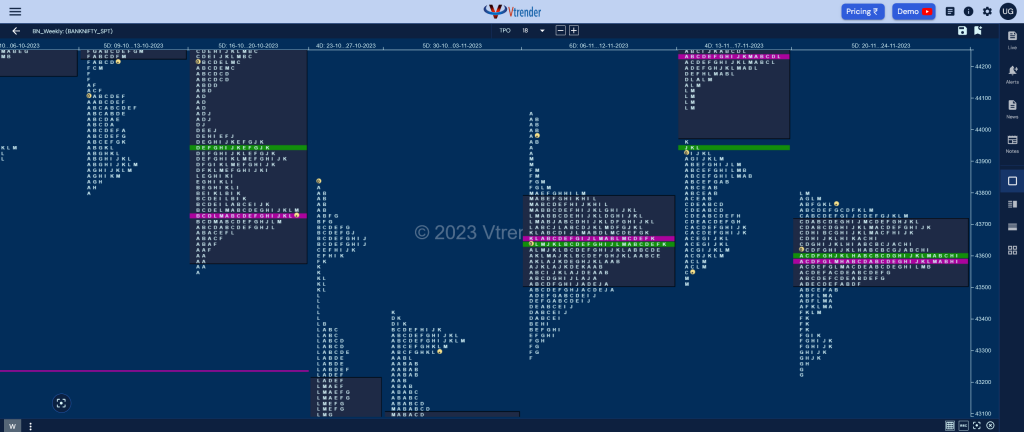
Previous week’s profile was a Neutral Extreme one to the downside with lot of TPOs forming similar highs in the zone between 44000-44020 along with a prominent POC at 44229 from where it gave a move away to the downside making new lows of 43513 before closing on Friday at 43584 way below the Value area of 43978 to 44420.

Monday – 43584 (43724 / 43450)
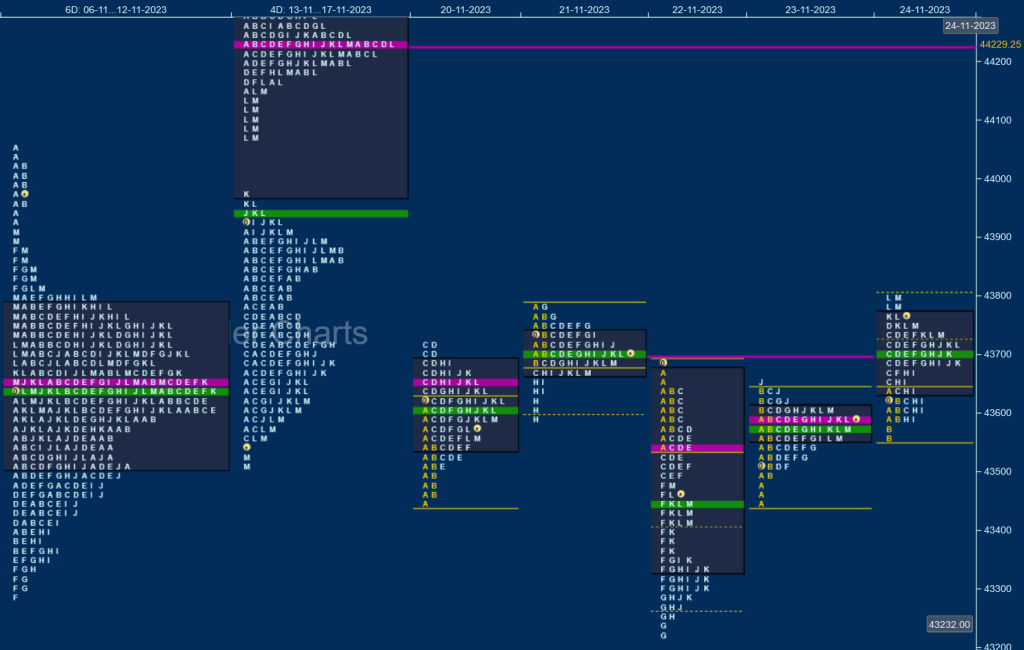
BankNifty opened with a look down below previous lows hitting 43450 but could not extend any further leaving a narrow 169 point range IB after which it made a C side extension to 43724 which stalled the upmove in typical manner leading to a nice Gaussian profile for the day with overlapping to lower Value
Tuesday – 43689 (43790 / 43586)
The auction opened with a gap up of over 200 points but made an OH (Open=High) start at 43790 after which it remained in a narrow 111 point range till the IB got over and followed it with another typical C side extension to 43672 which got rejected triggering a bounce back to 43778 in the G period but the failure to extend above IBH triggered a quick liquidation break down to 43586 in the H TPO where it left a small tail indicating lack of supply resulting in a close around the prominent POC of 43697
Wednesday – 43449 (43692 / 43230)
saw an Open Test Drive to the downside moving away from previous Value and making multiple REs (Range Extension) lower as it recorded new lows for the week at 43230 taking support just above the 03rd Nov low of 43221 which has formed the initiative buying tail for this month and this implied that those buyers were back defending this zone as it made a good pull back to 43481 into the close leaving a DD profile
Thursday – 43577 (43649 / 43451)
BankNifty remained inside previous profile filling up the upper part of the structure after leaving a mini buying tail from 43496 to 43451 and formed yet another very narrow 198 point range Normal Day building a prominent POC at 43590 where it eventually closed
Friday – 43769 (43806 / 43566)
The auction made an OAIR start leaving the narrowest IB range of just 81 points but importantly left an A period buying tail at Thursday’s POC of 43590 after which it made a big C side extension higher to 43741 but could only manage marginal new highs of 43754 indicating exhaustion to the upside which in turn triggered a retracement lower to 43588 where the prominent yPOC of 43590 was once again defended and this resulting in a short covering move into the close as it made new highs of 43806 for the week

This week’s profile remained in a narrow range of 576 points displaying poor trade facilitation at both extremes with a rejection on the downside from below the weekly lows of 43283 (06-10 Nov) whereas on the upside it remained below last week’s HVN of 43871 forming completely lower Value at 43521-43590-43719 with this week also leaving a Neutral Extreme profile but to the upside and has formed an ultra prominent POC at 43590 which can continue to act as a magnet in the coming week unless we get initiative activity at one of the extremes as mentioned above.
Click here to view this week’s MarketProfile of BankNifty on Vtrender Charts
Hypos for the week 28th Nov to 01st Dec 2023
| Up |
| 43770 – K TPO high (24 Nov) 43955 – SOC from 17 Nov 44156 – Mid-profile (16 Nov) 44309 – VPOC from 16 Nov 44505 – VPOC from 17 Oct 44597 – Weekly VPOC |
| Down |
| 43730 – 6-day VAH 17-24 Nov) 43590 – Weekly POC 43349 – SOC from 22 Nov 43226 – Buying Tail (03 Nov) 43020 – Singles mid-point 42889 – VPOC from 02 Nov |
