Nifty Jan F: 21888 [ 22025 / 21811 ]

| Open Type |
|---|
| OA (Open Auction) |
| Volumes of 8,873 contracts |
| Initial Balance |
|---|
| 63 points (21874 – 21811) |
| Volumes of 20,198 contracts |
| Day Type |
|---|
| Trend – 214 points |
| Volumes of 1,09,309 contracts |
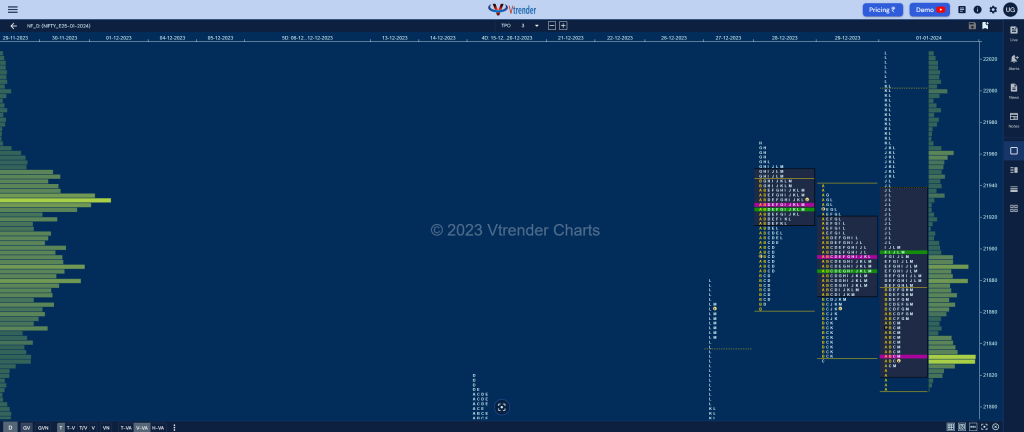
NF opened with a probe below PDL but could only manage to tag 21811 getting rejected back into previous range and made an attempt to enter the Value but stalled at 21874 forming a narrow 63 point range IB (Initial Balance) with tails at both ends as the C side tested the A period buying singles leaving a PBL at 21826 confirming demand holding this zone up.
The auction then made a slow probe higher making multiple REs (Range Extension) from the D to the I TPOs but all of them were marginal ones which failed to even complete the 1.5 IB target of 21906 hinting that it was only locals who were in play but this changed in the J period where a suddent influx of volumes resulted in an extension handle at 21900 and a trending move higher to new ATH of 22025 in the L marking the completion of the 3IB objective of 22000.
However, a combination of profit booking and some fresh supply first confirmed a responsive selling tail till 22004 followed by couple of SOCs (Scene Of Crime) at 21965 & 21900 as NF retraced the entire rise from the low of C side while making a low of 21827 into the close forming an Outside Bar both in terms of Value and Range.
Click here to view the latest profile in NF on Vtrender Charts
Daily Zones
- Largest volume (POC) was traded at 21831 F and VWAP of the session was at 21899
- Value zones (volume profile) are at 21819-21831-21937
- HVNs are at 21894 (** denotes series POC)
Weekly Zones
- to be updated…
Monthly Zones
- The settlement day Roll Over point (January 2024) is 21930
- The VWAP & POC of Dec 2023 Series is 21226 & 21377 respectively
- The VWAP & POC of Nov 2023 Series is 19562 & 19806 respectively
- The VWAP & POC of Oct 2023 Series is 19468 & 19537 respectively
Business Areas for 02nd Jan 2024
| Up |
| 21899 – VWAP from 01 Jan 21930 – Roll Over point 21965 – SOC from 01 Jan 22004 – Selling tail (01 Jan) 22050 – Weekly 2 IB |
| Down |
| 21874 – IBH from 01 Jan 21831 – dPOC from 01 Jan 21799 – Ext Handle (27 Dec) 21754 – VPOC from 27 Dec 21702 – Buying Tail (27 Dec) |
BankNifty Jan F: 48535 [ 48869 / 48389 ]

| Open Type |
|---|
| OAIR (Open Auction In Range) |
| Volumes of 8,074 contracts |
| Initial Balance |
|---|
| 210 points (48641 – 48431) |
| Volumes of 21,580 contracts |
| Day Type |
|---|
| Neutral – 480 points |
| Volumes of 1,20,422 contracts |
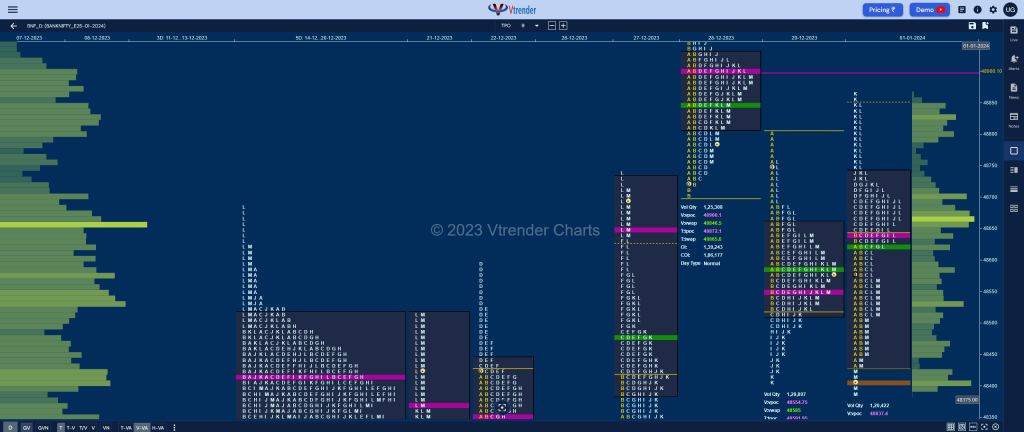
BNF made an OAIR start taking support just above previous session’s mini tail from 48420 to 48404 as it made a low of 48431 and got back into the balanced Value area triggering the 80% rule which it completed with the help of a C side extension to 48691 and followed it up with marginal new high of 48725 in the D.
The auction then gave a small retracement to day’s VWAP leaving a PBL at 48619 in the G period indicating that the morning buyers were still in play and made a fresh RE in the J TPO which was succeeded by another big one in the K where it got above PDH and entered 28th Dec’s Value making a high of 48869 stopping just short of the VPOC of 48900 as it found supply coming back at that day’s VWAP of 48847 seen in the small tail it confirmed at the top.
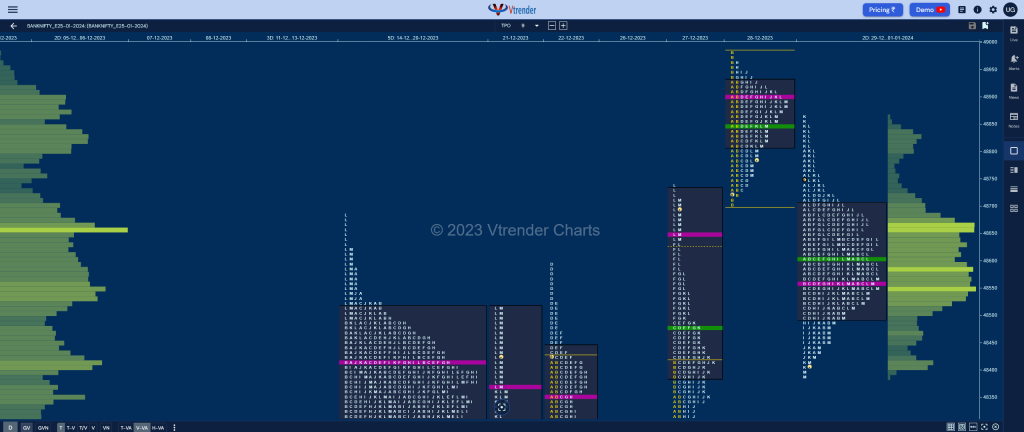
BNF then made a reatracement down to day’s VWAP breaking below it for the first time post A period causing a deep liquidation break which resulted in marginal new lows for the day at 48389 into the close leaving a Neutral Day and and Outside bar both in terms of range & value. We now have a nice 2-day Gaussian Curve with Value at 48500-48552-48704 and needs to be seen if we remain in this balance or move away from here in the coming session(s). (Click here to view the composite only on Vtrender Charts)

Click here to view the latest profile in BNF on Vtrender Charts
Daily Zones
- Largest volume (POC) was traded at 48637 F and VWAP of the session was at 48622
- Value zones (volume profile) are at 48435-48637-48739
- HVNs are at 48555 (** denotes series POC)
Weekly Zones
- to be updated…
Monthly Zones
- The settlement day Roll Over point (January 2024) is 48900
- The VWAP & POC of Dec 2023 Series is 47337 & 47918 respectively
- The VWAP & POC of Nov 2023 Series is 43837 & 43619 respectively
- The VWAP & POC of Oct 2023 Series is 43718 & 44346 respectively
Business Areas for 02nd Jan 2024
| Up |
| 48534 – Closing HVN (01 Jan) 48622 – VWAP from 01 Jan 48740 – SOC from 01 Jan 48900 – VOC from 28 Dec 49103 – 1 ATR from 48552 |
| Down |
| 48500 – 2-day VAL (29Dec-01Jan) 48354 – HVN from 27 Dec 48245 – Buying Tail (27 Dec) 48107 – VWAP from 26 Dec 47964 – VPOC from 26 Dec |
You can check the monthly charts & other swing levels for both Nifty & BankNifty here & for the weekly charts & analysis, please click here.
