Nifty Jan F: 21756 [ 21870 / 21674 ]

| Open Type |
|---|
| OAIR (Open Auction In Range) |
| Volumes of 12,446 contracts |
| Initial Balance |
|---|
| 125 points (21870 – 21674) |
| Volumes of 46,046 contracts |
| Day Type |
|---|
| Normal Variation – 196 points |
| Volumes of 1,67,847 contracts |
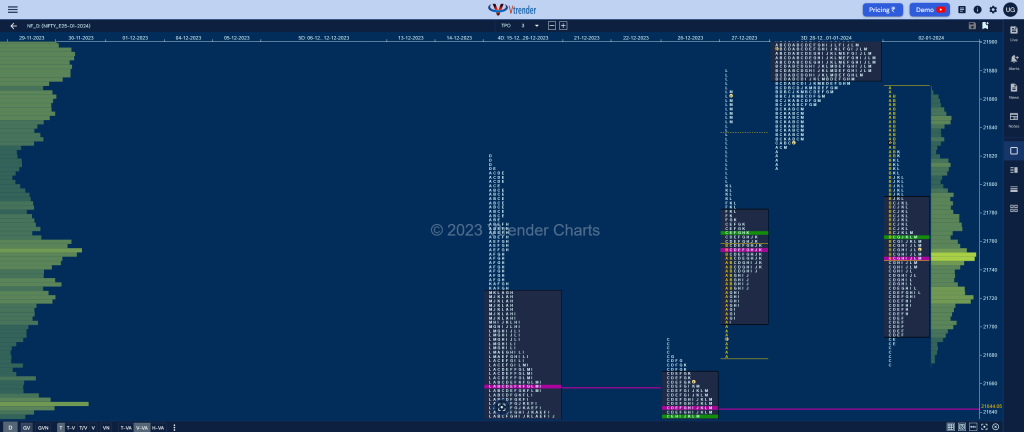
NF opened in previous value but could not get above the IBH of 21874 which was also the 3-day composite VAL indicating that the PLR (Path of Least Resistance) was to the downside and it gave more confirmation of this with an extension handle at 21820 in the B period as it went on to negate the buying one of 21799 from 27th Dec and went on to tag that day’s VPOC of 21754 while making a low of 21745.
The auction continued the imbalance with a big C side move lower getting into the A period buying tail from 21702 to 21680 and made a look down below as it hit 21674 which marked the lows for the day with even the dPOC shifting down to 21720 after which it first formed a mini balance below day’s VWAP leaving a PBH at 21763 in the G TPO and the subsequent probe lower took support at 21708 in the H signalling that the upside probe was still not over.
NF eventually scaled above VWAP in the J period and went on to revisit the extension handle of 21820 but could only manage to tag 21824 in the K TPO which showed that supply was still active in this zone and resulted in a probe back down to 21725 in the L before settling down to close around the dPOC which had shifted higher to 21748 forming completely lower Value for the day.
Click here to view the latest profile in NF on Vtrender Charts
Daily Zones
- Largest volume (POC) was traded at 21748 F and VWAP of the session was at 21762
- Value zones (volume profile) are at 21695-21748-21790
- HVNs are at 21890 (** denotes series POC)
Weekly Zones
- to be updated…
Monthly Zones
- The settlement day Roll Over point (January 2024) is 21930
- The VWAP & POC of Dec 2023 Series is 21226 & 21377 respectively
- The VWAP & POC of Nov 2023 Series is 19562 & 19806 respectively
- The VWAP & POC of Oct 2023 Series is 19468 & 19537 respectively
Business Areas for 03rd Jan 2024
| Up |
| 21768 – L TPO VWAP (02 Jan) 21824 – PBH from 02 Jan 21874 – 3-day VAL (28Dec-01Jan) 21906 – 3-day VWAP (28Dec-01Jan) 21949 – 3-day VAH (28Dec-01Jan) |
| Down |
| 21748 – dPOC from 02 Jan 21708 – PBL from 02 Jan 21644 – VPOC from 26 Dec 21600 – Mid-profile singles (26 Dec) 21550 – Buying Tail (26 Dec) |
BankNifty Jan F: 47946 [ 48490 / 47877 ]

| Open Type |
|---|
| OA (Open Auction) |
| Volumes of 20,284 contracts |
| Initial Balance |
|---|
| 304 points (48490 – 48186) |
| Volumes of 55,591 contracts |
| Day Type |
|---|
| ‘b’ shape – 613 points |
| Volumes of 1,78,046 contracts |
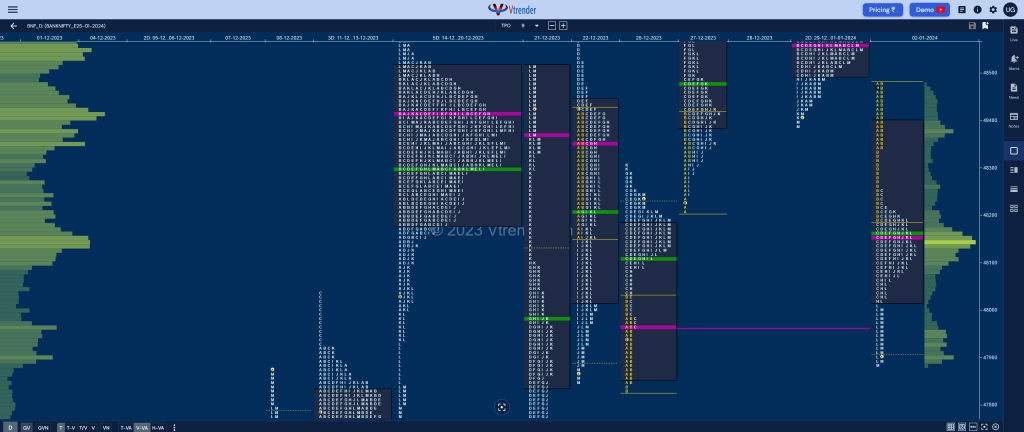
BNF made an Open Auction start but remained below the 2-day VAL of 48500 leaving similar highs at 48490 & 48475 in the A & B periods and made an early extension handle at 48346 confirming that the sellers were in control after which it made it’s habitual C side extension breaking below 26th Dec’s VWAP of 48107 while making a low of 48025.
The auction then turned back to form a narrow range balance but left important PBHs at 48213, 48209 & 48208 getting rejected multiple times at day’s VWAP displaying the aggressive stance of supply and this triggered a spike lower into the close from 48011 to 47877 as it tagged 26th Dec’s VPOC of 47964 making an adjusted close around it.
BNF has formed a long liquidation ‘b’ shape profile completely lower Value and looks set to continue on the downside in the coming session as long as it gets accepted below today’s spike zone for a test of the A period buying tails of 47844 & 47425 from 26th & 21st Dec respectively.
Click here to view the latest profile in BNF on Vtrender Charts
Daily Zones
- Largest volume (POC) was traded at 48156 F and VWAP of the session was at 48160
- Value zones (volume profile) are at 48016-48156-48400
- HVNs are at 48555 (** denotes series POC)
Weekly Zones
- to be updated…
Monthly Zones
- The settlement day Roll Over point (January 2024) is 48900
- The VWAP & POC of Dec 2023 Series is 47337 & 47918 respectively
- The VWAP & POC of Nov 2023 Series is 43837 & 43619 respectively
- The VWAP & POC of Oct 2023 Series is 43718 & 44346 respectively
Business Areas for 03rd Jan 2024
| Up |
| 47999 – L TPO VWAP (02 Jan) 48160 – VWAP from 02 Jan 48256 – Mid-profile tail (02 Jan) 48346 – Ext Handle (02 Jan) 48500 – 2-day VAL (29Dec-01Jan) |
| Down |
| 47929 – M TPO VWAP (02 Jan) 47844 – Buying Tail (26 Dec) 47720 – Ext Handle (21 Dec) 47575 – B TPO VWAP (21 Dec) 47425 – Buying Tail (21 Dec) |
You can check the monthly charts & other swing levels for both Nifty & BankNifty here & for the weekly charts & analysis, please click here.
