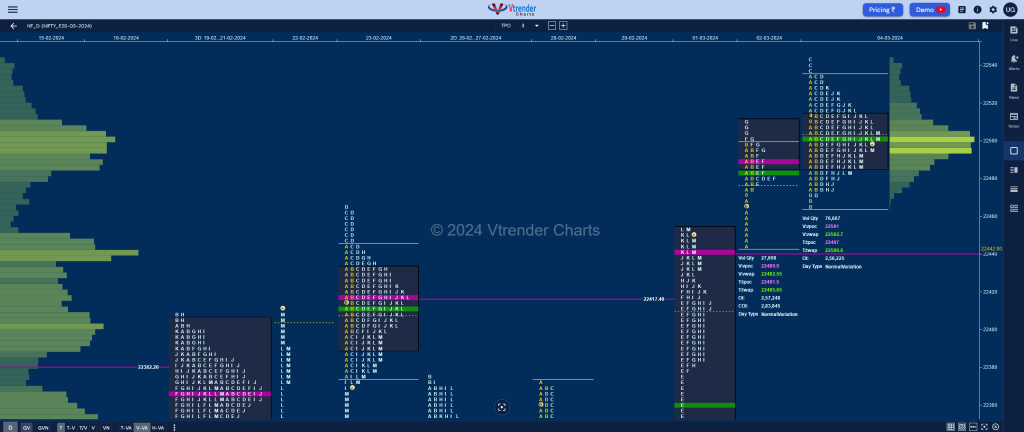
Nifty Mar F: 22498 [ 22545 / 22466 ]

| Open Type |
|---|
| OA (Open Auction) |
| Volumes of 9,191 contracts |
| Initial Balance |
|---|
| 69 points (22535 – 22466) |
| Volumes of 21,284 contracts |
| Day Type |
|---|
| Normal – 79 pts |
| Volumes of 75,588 contracts |
NF formed a narrow range Gaussian Curve for the day making the expected move from 01st Mar’s Trend Day imbalance to a balance displaying poor trade facilitation all day and awaits return of OTF players for a move away from this beautiful Bell profile.
Click here to view the latest profile in NF on Vtrender Charts
Daily Zones
- Largest volume (POC) was traded at 22497 F and VWAP of the session was at 22502
- Value zones (volume profile) are at 22485-22497-22514
- NF confirmed a FA at 22022 on 29/02 and completed the 2 ATR objective of 22456
- HVNs are at NA (** denotes series POC)
Weekly Zones
- Weekly Charts can be viewed here
- (23-29 Feb) – to be updated
Monthly Zones
- The settlement day Roll Over point (March 2024) is 22188
- The VWAP & POC of Feb 2024 Series is 21956 & 21930 respectively
- The VWAP & POC of Jan 2024 Series is 21581 & 21635 respectively
- The VWAP & POC of Dec 2023 Series is 21226 & 21377 respectively
Business Areas for 05th Mar 2024
| Up |
| 22514 – VAH (04-Mar) 22564 – 1 ATR (VWAP 22360) 22605 – 1 ATR (WPOC 22113) 22662 – Weekly ATR 22701 – 1 ATR (yPOC 22497) |
| Down |
| 22485 – VAL (04-Mar) 22443 – VPOC (01-Mar) 22403 – I TPO halfback 22360 – VWAP (01-Mar) 22316 – Ext Handle (01-Mar) |
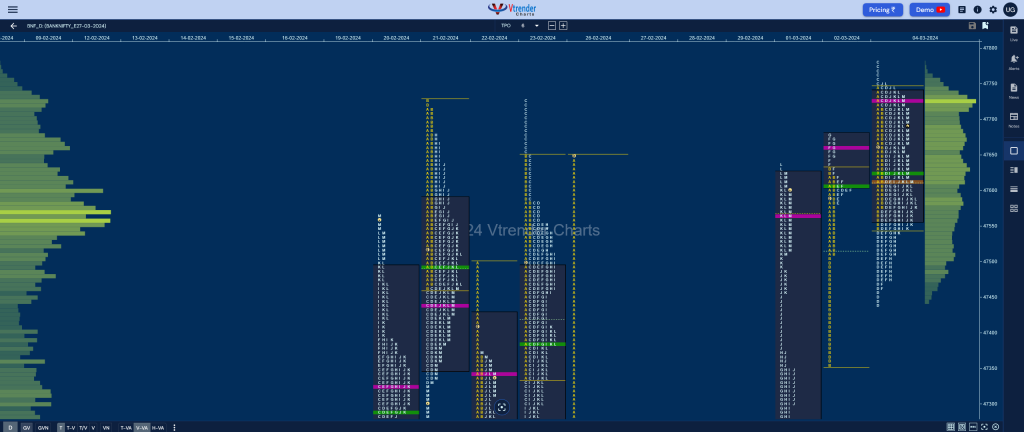
BankNifty Mar F: 47691 [ 47780 / 47424]

| Open Type |
|---|
| OA (Open Auction) |
| Volumes of 16,394 contracts |
| Initial Balance |
|---|
| 202 points (47745 – 47543) |
| Volumes of 35,702 contracts |
| Day Type |
|---|
| Neutral– 356 points |
| Volumes of 1,38,974 contracts |
BNF saw some supply coming back at the open after the big move it made on the upside which was right from previous selling zone from 17th Jan which had a SOC (Scene Of Crime) at 47755 level as it first made a low of 47543 in the IB (Initial Balance) taking support around 01st Mar’s POC of 47567 indicating that the sellers were not adding at lower levels.
The auction then went on to make a typical C side extension to 47780 and was swiftly rejected as it broke below VWAP and made an RE (Range Extension) in the D period to 47424 confirming a FA (Failed Auction) at highs but could not negate the J TPO buy zone from 01st Mar and selttled down to form a balance for the rest of the day leaving a Neutral Centre profile.
Click here to view the latest profile in BNF on Vtrender Charts
Daily Zones
- Largest volume (POC) was traded at 47729 F and VWAP of the session was at 47622
- Value zones (volume profile) are at 47560-47729-47741
- HVNs are at NA** (** denotes series POC)
Weekly Zones
- Weekly Charts can be viewed here
- (22-29 Feb) – to be updated
Monthly Zones
- The settlement day Roll Over point (March 2024) is 46610
- The VWAP & POC of Feb 2024 Series is 46119 & 45700 respectively
- The VWAP & POC of Jan 2024 Series is 46353 & 48119 respectively
- The VWAP & POC of Dec 2023 Series is 47337 & 47918 respectively
Business Areas for 05th Mar 2024
| Up |
| 47749 – Sell tail (04 Mar) 47861 – B TPO VWAP (17 Jan) 48093 – IB singles mid (17 Jan) 48242 – Day high (17 Jan) 48379 – Mid-profile tail (12 Jan) |
| Down |
| 47680 – M TPO VWAP 47543 – IBL (04 Mar) 47403 – J TPO VWAP (01 Mar) 47186 – VWAP (01 Mar) 46999 – Ext Handle (01 Mar) |
You can check the monthly charts & other swing levels for both Nifty & BankNifty here & for the weekly charts & analysis, please click here.
