Nifty Nov F: 19482 [ 19506 / 19375 ]

| Open Type |
|---|
| OAOR (Open Auction Out of Range) |
| Volumes of 19,375 contracts |
| Initial Balance |
|---|
| 49 points (19424 – 19375) |
| Volumes of 31,615 contracts |
| Day Type |
|---|
| Normal Variation (with a spike close) – 131 points |
| Volumes of 98,682 contracts |
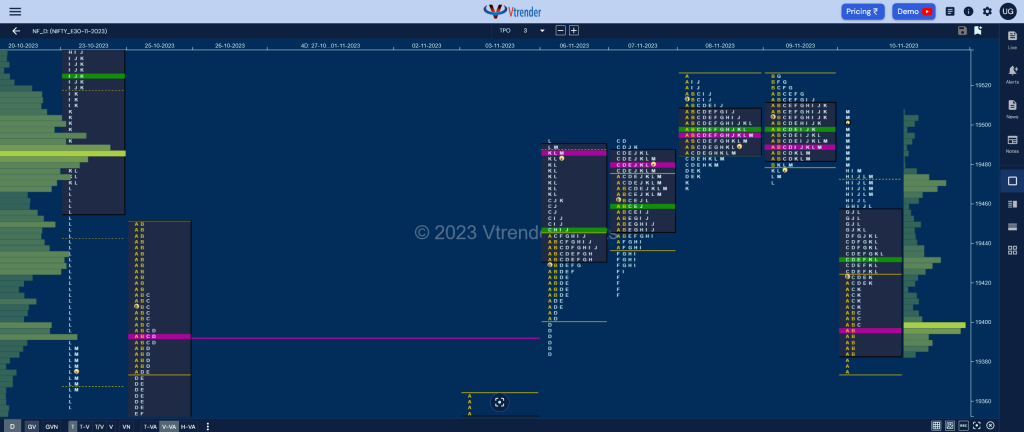
NF not only opened lower but made an OH (Open=High) start at 19424 and went on to tag 06th Nov’s FA (Failed Auction) of 19385 while making a low of 19375 and as expected got some demand coming back as could be seen in the tiny buying tail it left at lows at the end of the Initial Balance (IB) and dPOC forming at 19397.
More confirmation of buyers taking control came with a C side extension to 19440 after which the auction remained above day’s VWAP and made another couple of good REs (Range Extension) in the G & H TPOs completing the 2 IB objective of 19473 for the day but stalled just below previous Value as it made similar highs of 19478 suggesting that the inventory had gotten too long which triggered a liquidation drop in the J & K periods where it not only broke below VWAP but got back into the IB but took support just above the SOC (Scene Of Crime) of 19405 leaving a PBL at 19407.
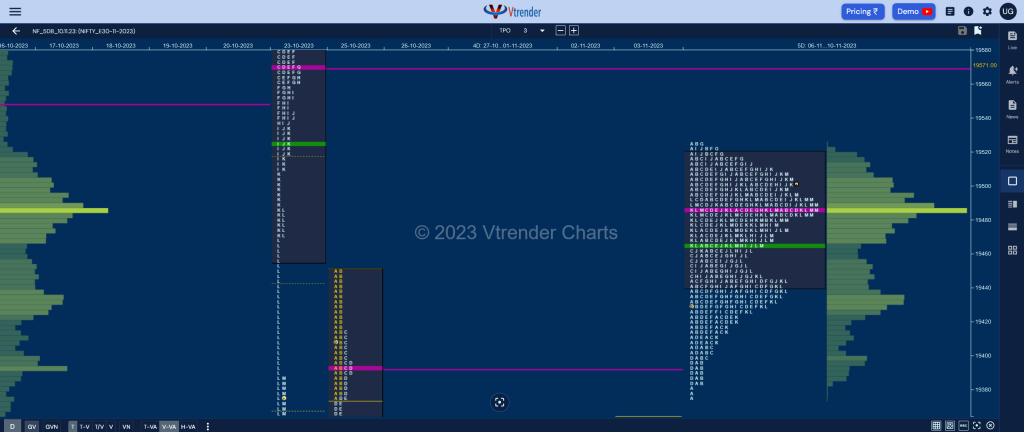
Buyers came back strongly once again in this zone as they first retraced the entire drop of the last 2 TPOs in L before spiking higher to 19506 in the M period almost completing the 80% Rule in the 2-day Value and this spike zone from 19478 to 19506 will be the reference for the next open as Spike Rules will be in play. On the higher timeframe, the move away from the 2-day balance got aborted at the FA of 19385 and this push back to 19506 means we have a 5-day composite forming in NF with the Value at 19440-19487-19519 with a good chance of an attempt to check the upside with the similar highs of 19526 & 23rd Oct’s VPOC of 19571 being the immediate objectives as long as today’s spike zone is held. (Click here to view the composite chart only on Vtrender Charts)

Click here to view the latest profile in NF on Vtrender Charts
Daily Zones
- Largest volume (POC) was traded at 19397 F and VWAP of the session was at 19433
- Value zones (volume profile) are at 19385-19397-19457
- NF confirmed a FA at 19385 on 06/11 and the 1 ATR objective comes to 19544. This FA got re-visited on 10/11 and saw demand coming back hence is still a valid reference.
- HVNs are at 19129 / 19213 / 19486** (** denotes series POC)
Monthly Zones
- The settlement day Roll Over point (November 2023) is 18964
- The VWAP & POC of Oct 2023 Series is 19468 & 19537 respectively
- The VWAP & POC of Sep 2023 Series is 19736 & 19672 respectively
- The VWAP & POC of Aug 2023 Series is 19440 & 19424 respectively
Business Areas for 13th Nov 2023
| Up |
| 19487 – 5-day POC (06-10 Nov) 19519 – 5-day VAH (06-10 Nov) 19542 – 1 ATR (yPOC 19397) 19571 – VPOC (23 Oct) 19621 – Ext Handle (23 Oct) |
| Down |
| 19478 – Spike Low (10 Nov) 19433 – VWAP from 10 Nov 19397 – dPOC from 10 Nov 19363 – Daily Ext Handle 19330 – VPOC from 06 Nov |
BankNifty Nov F: 43952 [ 44017 / 43687 ]

| Open Type |
|---|
| OA (Open Auction) |
| Volumes of 18,204 contracts |
| Initial Balance |
|---|
| 114 points (43801 – 43687) |
| Volumes of 29,387 contracts |
| Day Type |
|---|
| Normal Variation – 330 points |
| Volumes of 1,38,807 contracts |
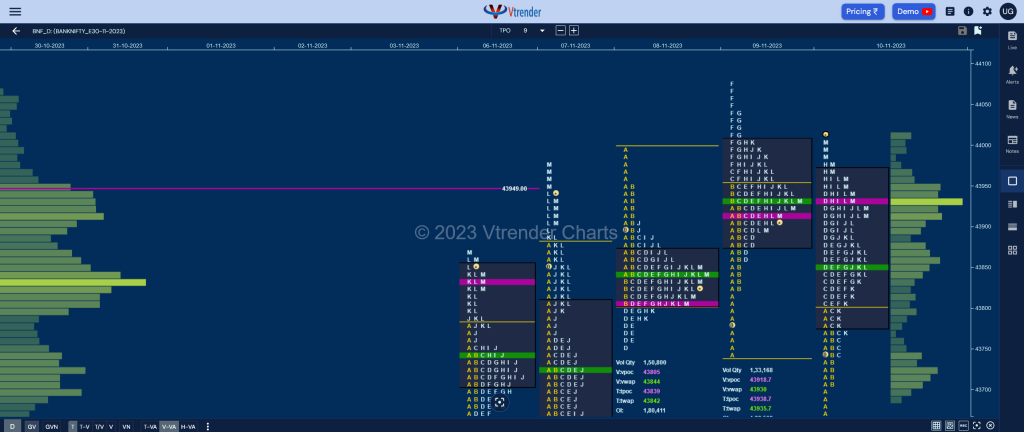
NF made a gap down open of 175 points and broke below 07th Nov’s NeuX VWAP of 43729 while making a low of 43687 in the A period but could not extend any further as it made a narrow 45 point range in the B leaving tails at both ends of the Initial Balance. (P.S: There was a freak tick at 43355 at open but no volumes were seen below 43705 in OrderFlow)
The auction then made a C side extension to 43840 negating the A period selling tail and followed it up with a bigger RE in the D TPO as it got back into previous day’s Value and tagged yVWAP of 43930 while making a high of 43939 marking the completion of the 2 IB target also which was at 43915 and expectedly saw some profit booking causing a retracement down to 43805 in the E period.
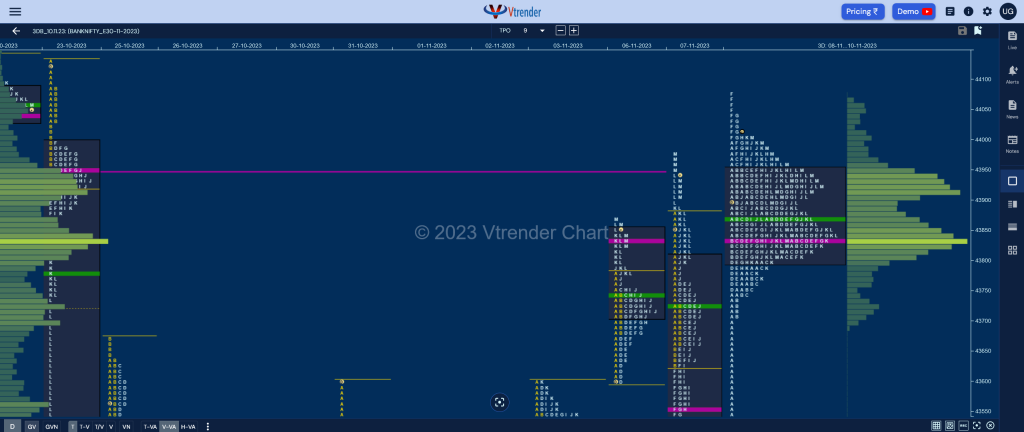
BNF resumed it’s upmove in the G period making a higher high than F and went on to make a fresh RE to 43979 in the H TPO but could not sustain triggering a quick 200 point drop down to 43773 in the K period stopping just above morning’s SOC of 43772 indicating that the buyers were back and they went on to probe higher hitting new highs of 44017 into the close leaving a mini 3-1-3 composite over the last 3 days with Value at 43800-43832-43947 and has a good chance of moving away from this balance in the coming sessions provided it is backed by initiative volumes. (Click here to view the composite chart only on Vtrender Charts)

Click here to view the latest profile in BNF on Vtrender Charts
Daily Zones
- Largest volume (POC) was traded at 43935 F and VWAP of the session was at 43859
- Value zones (volume profile) are at 43781-43935-43973
- HVNs are at 42928 / 43184 / 43832** (** denotes series POC)
Monthly Zones
- The settlement day Roll Over point (November 2023) is 42564
- The VWAP & POC of Oct 2023 Series is 43718 & 44346 respectively
- The VWAP & POC of Sep 2023 Series is 44808 & 44438 respectively
- The VWAP & POC of Aug 2023 Series is 44493 & 44550 respectively
Business Areas for 13th Nov 2023
| Up |
| 43973 – M TPO VWAP (10 Nov) 44043 – Selling tail (09 Nov) 44143 – Selling tail (20 Oct) 44289 – LVN from 20 Oct 44425 – DD VWAP (18 Oct) |
| Down |
| 43947 – 3-day VAH (08-10 Nov) 43832 – 3-day POC (08-10 Nov) 43704 – Buying Tail (10 Nov) 43625 – SOC from 07 Nov 43514 – VPOC from 03 Nov |
You can check the monthly charts & other swing levels for both Nifty & BankNifty here & for the weekly charts & analysis, please click here.
