Nifty Mar F: 22133 [ 22192 / 22000 ]

| Open Type |
|---|
| OAIR (Open Auction In Range) |
| Volumes of 19,298 contracts |
| Initial Balance |
|---|
| 151 points (22192 – 22041) |
| Volumes of 55,998 contracts |
| Day Type |
|---|
| Normal Variation – 193 pts |
| Volumes of 1,79,780 contracts |
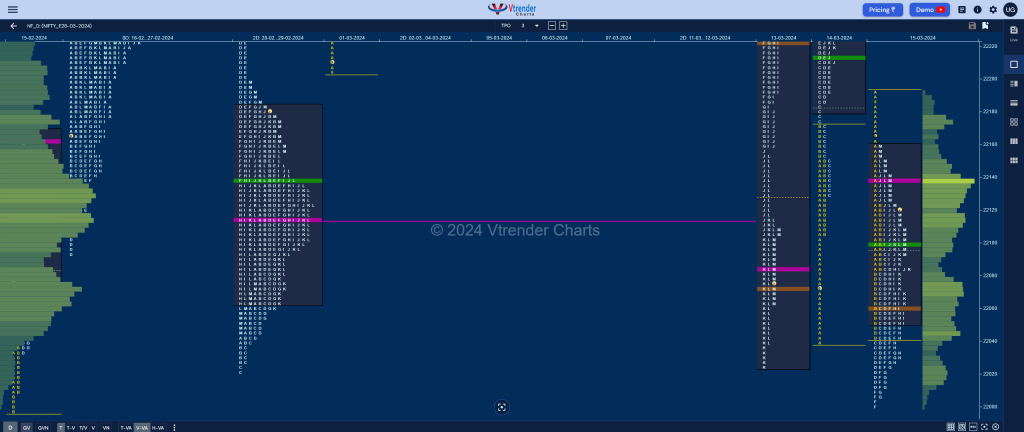
NF opened lower well below previous VWAP of 22213 indicating that the sellers were back and not only negated the extension handle of 22170 but went on to probe below the buying tail of 22034 as it made multiple REs (Range Extension) lower tagging the FA & swing reference of 22022 while making a low of 22000 in the F period.
However, the auction found support at the BRN (Big Round Number) marking the end of the OTF (One Time Frame) lower which brought in some profit booking by shorts along with demand coming back as could be seen in the probe above day’s VWAP in the H TPO and a test of the A period selling tail as it went on to make a high of 22158 in the M period.
Value for the day was completely lower which saw some buying interest coming in at 22017 & 22060 which will be the support levels for the next session along with the VWAP of 22098 whereas on the upside, the dPOC which shifted higher to 22137 into the close opening reference.
Click here to view the latest profile in NF on Vtrender Charts
Daily Zones
- Largest volume (POC) was traded at 22137 F and VWAP of the session was at 22098
- Value zones (volume profile) are at 22052-22137-22160
- NF confirmed a FA at 22022 on 29/02 and completed the 2 ATR objective of 22456. This FA was tagged on 15/03 and saw some demand coming back so still a valid swing support.
- HVNs are at 22393 / 22443** / 22497 / 22596 (** denotes series POC)
Weekly Zones
- Weekly Charts can be viewed here
- (08-14 Mar) – NF has formed a Double Distribution Trend Down profile on the weekly as it left an initiative selling tail at previous week’s VAH and went on to probe lower swiping through the Value Areas of last couple of weeks tagging the 23-29 Feb’s VPOC of 22113 and made a low of 22025 taking support just above the daily FA of 22022 from 29th Feb. Value for the week was overlapping on both sides at 22286-22442-22593 with the VWAP at 22316 which will be the immediate supply point for the new week
- (01-07 Mar) – NF opened the week with an initiative probe to the upside right from the Mar RO point of 22188 as it left a buying tail from 22259 to 22180 and went on to record similar highs of 22547 & 22545 triggering a round of profit booking as it made a retracement down to 22322 taking support just above previous week’s VAH of 22293 and saw demand coming back resulting in a fresh imbalance and new ATH of 22620 but lack of fresh buying led to another round of profit booking as the auction came down to 22526 before closing the week at 22552 leaving a Normal Variation profile with completely higher Value at 22335-22443-22551 with the VWAP at 22452.
Monthly Zones
- The settlement day Roll Over point (March 2024) is 22188
- The VWAP & POC of Feb 2024 Series is 21956 & 21930 respectively
- The VWAP & POC of Jan 2024 Series is 21581 & 21635 respectively
- The VWAP & POC of Dec 2023 Series is 21226 & 21377 respectively
Business Areas for 18th Mar 2024
| Up |
| 22137 – POC (15 Mar) 22174 – A TPO POC (15 Mar) 22211 – Selling tail mid (15 Mar) 22266 – VPOC (14 Mar) 22301 – G TPO VWAP (14 Mar) |
| Down |
| 22132 – M TPO VWAP (15 Mar) 22098 – VWAP (15 Mar) 22060 – HVN (15 Mar) 22017 – G TPO POC (15 Mar) 21983 – K TPO VWAP (14 Feb) |
BankNifty Mar F: 46694 [ 46987 / 46440 ]

| Open Type |
|---|
| OAIR (Open Auction In Range) |
| Volumes of 11,150 contracts |
| Initial Balance |
|---|
| 432 points (46987 – 46555) |
| Volumes of 47,063 contracts |
| Day Type |
|---|
| Normal – 547 points |
| Volumes of 1,84,947 contracts |
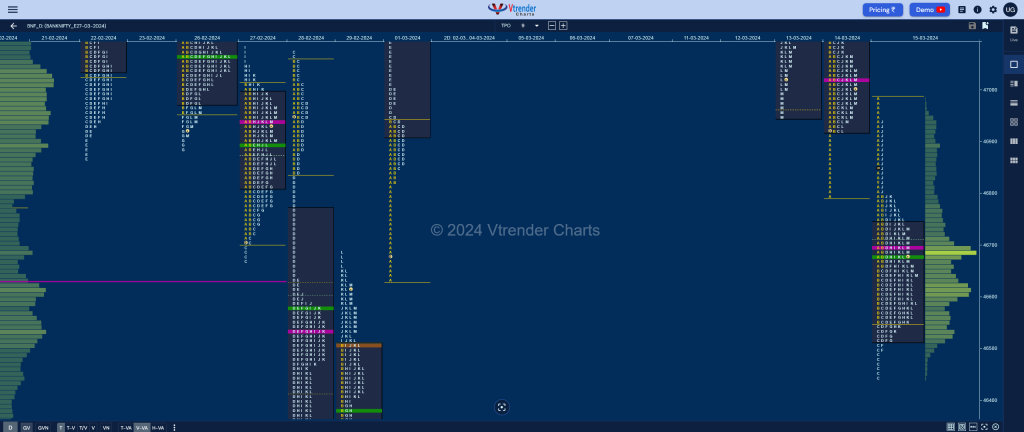
BNF as expected opened lower and went on to tag Mar’s RO point of 46610 in the IB while making a low of 46555 and also completed the 2 ATR target of 46442 from the FA of 47468 via a typical C side extension to 46440 which also marked the lows for the day.
The auction then remained in a narrow range for most part of the day forming a ‘b’ shape profile and made a swipe higher in the J TPO where it got into the A period selling tail but got stalled right at that TPOs VWAP of 46940 triggering a move back to 46530 which was also an earlier weekly VPOC where it left a PBL before closing around the POC of 46699.
BNF has formed a nice balanced profile with completely lower Value so has a good chance of giving a move away from this zone in the coming session provided it is backed by some initiative volumes at the open with 46699 being the immediate reference on the upside for a move towards 14th Mar’s VPOC of 47024 whereas on the downside, supply below POC could get a test of 29th Feb’s VWAP of 46383 as the first objective.
Click here to view the latest profile in BNF on Vtrender Charts
Daily Zones
- Largest volume (POC) was traded at 46699 F and VWAP of the session was at 46681
- Value zones (volume profile) are at 46513-46699-46742
- BNF confirmed a FA at 47684 on 13/03 and tagged the 2 ATR objective of 464427 on 15/03
- HVNs are at 47521** / 48217 (** denotes series POC)
Weekly Zones
- Weekly Charts can be viewed here
- (07-14 Mar) – BNF has formed an inside bar on the weekly with overlapping to lower value at 47000-47518-47593 and is a Trend Down one which has moved away to the downside from the prominent POC of 47518 so this week’s VWAP of 47600 will now be the swing reference for the coming week
- (01-06 Mar) – BNF left a Trend Up weekly profile hitting the 2 IB target of 48343 forming completely higher value at 47444-47567-48229 with a closing HVN at 48217 which will be the immediate reference on the upside in the coming week staying above which it could go for the higher VPOC of 48480 and HVN of 48864 from the weekly profile of 11th to 17th Jan whereas on the downside, this week’s VWAP of 47694 will be an important swing support.
Monthly Zones
- The settlement day Roll Over point (March 2024) is 46610
- The VWAP & POC of Feb 2024 Series is 46119 & 45700 respectively
- The VWAP & POC of Jan 2024 Series is 46353 & 48119 respectively
- The VWAP & POC of Dec 2023 Series is 47337 & 47918 respectively
Business Areas for 18th Mar 2024
| Up |
| 46742 – VAH (15 Mar) 46869 – J TPO POC 47024 – VPOC (14 Mar) 47199 – I TPO halfback 47335 – G TPO VWAP |
| Down |
| 46691 – M TPO VWAP 46530 – PBL (15 Mar) 46383 – VWAP (29-Feb) 46241 – VPOC (29-Feb) 46062 – Buy Tail (29-Feb) |
You can check the monthly charts & other swing levels for both Nifty & BankNifty here & for the weekly charts & analysis, please click here.
