Nifty Nov F: 19829 [ 19934 / 19695 ]

| Open Type |
|---|
| OAIR (Open Auction In Range) |
| Volumes of 8,712 contracts |
| Initial Balance |
|---|
| 82 points (19778 – 19695) |
| Volumes of 26,081 contracts |
| Day Type |
|---|
| Trend Day – 238 points |
| Volumes of 1,33,013 contracts |
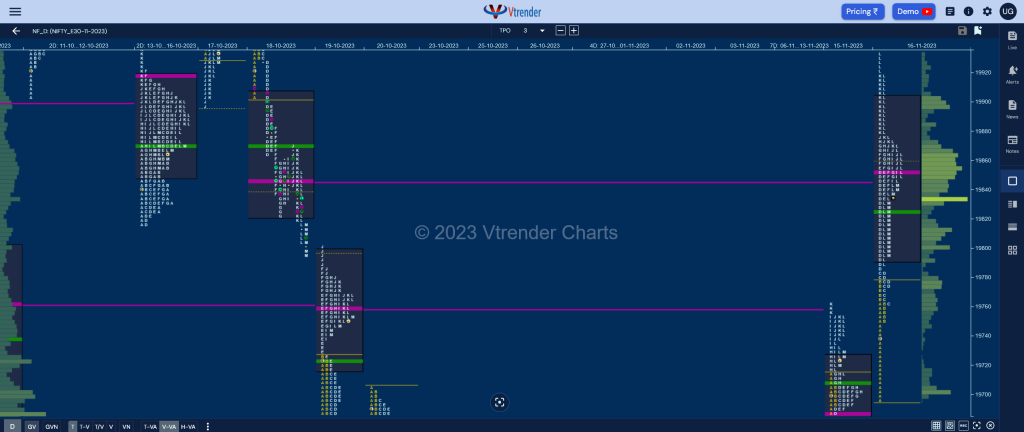
NF opened just below previous session’s SOC of 19740 and probed below the extension handle of 19715 while making a low of 19695 where it found demand coming back just above the POC of 19687 after which it not only got back above 19740 but went on to leave an extension handle at 19762 in the B period hitting new highs of 19778.
The auction then made a C side extension to 19785 stalling right at the Business Area reference from 19th Oct but the dip could only manage to tag 19764 indicating that the buyers were defending 19762 and more confirmation of this came with the second extension handle at 19785 in the D TPO where it scaled above 18th Oct’s selling reference of 19820 and went on to tag the weekly VPOC of 19850 (13th to 19th Oct).
The OTF (One Time Frame) probe higher continued till the H period though the extensions became smaller as NF tested 18th Oct’s Trend Day VWAP of 19869 while making a high of 19872 and gave a small dip in the I period where it left a PBL at 19847 showing change of polarity at 18th Oct’s VPOC of 19845 triggering a fresh probe higher in the K & L TPOs where it left the third extension handle for the day at 19877 and went on to tag that day’s SOC of 19931 while making a high of 19934 almost completing the 3 IB objective of 19942 for the day.
However, the 19931 reference was not able to hold triggering a big liquidation break into the close as the auction not only negated the immediate extension handle of 19877 but went on to break below the PBL of 19847 & day’s VWAP resulting in more pain for the buyers and a low of 19790 at the close of L period as the morning extension handle of 19785 held resulting in a small bounce back to 19844 into the close leaving a rare Trend Day which retraced most of it’s upmove.
Click here to view the latest profile in NF on Vtrender Charts
Weekly Settlement (10th to 16th Nov) : 19829 [ 19934 / 19375 ]

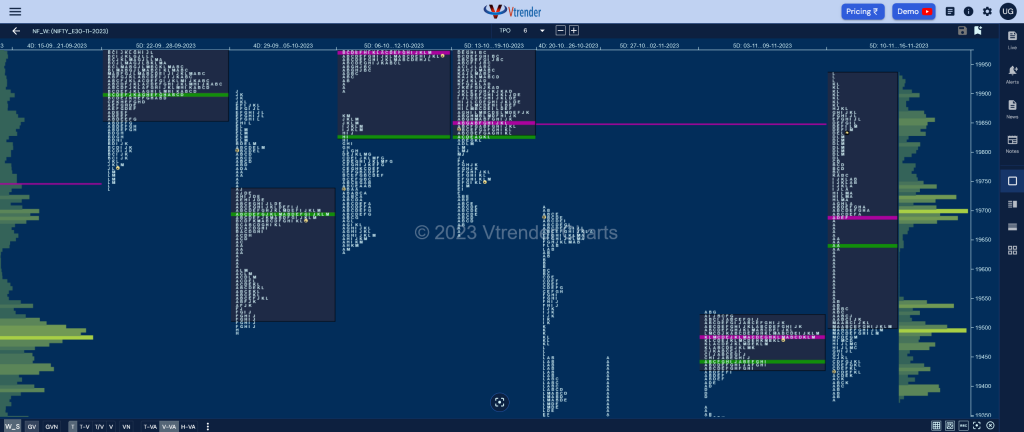
NF opened the week with a test of the daily FA of 19385 from 06th Nov and saw buyers come back strongly resulting in an elongated Double Distribution Trend Up weekly profile with a lower HVN at 19495 along with a zone of singles from 19688 to 19530 as it not only completed the 2 ATR objective of 19704 from 19385 but went on to tag the weekly VPOC of 19853 (13-19 Oct) while making a high of 19934. Value formed was mostly higher at 19502-19688-19933 with this week’s VWAP at 19643 which will be the important level to hold for the buyers to remain in control for the coming week.
Daily Zones
- Largest volume (POC) was traded at 19853 F and VWAP of the session was at 19826
- Value zones (volume profile) are at 19791-19853-19903
- NF confirmed a FA at 19385 on 06/11 and tagged the 2 ATR objective of 19704 on 15/11
- HVNs are at 19129 / 19213 / 19486** (** denotes series POC)
Monthly Zones
- The settlement day Roll Over point (November 2023) is 18964
- The VWAP & POC of Oct 2023 Series is 19468 & 19537 respectively
- The VWAP & POC of Sep 2023 Series is 19736 & 19672 respectively
- The VWAP & POC of Aug 2023 Series is 19440 & 19424 respectively
Business Areas for 17th Nov 2023
| Up |
| 19847 – SOC from 16 Nov 19895 – HVN from 16 Nov 19934 – PDH 19976 – Swing High (17 Oct) 20007 – SOC from 22 Sep |
| Down |
| 19826 – VWAP from 16 Nov 19790 – PBL from 16 Nov 19749 – Buying Tail (16 Nov) 19702 – A TPO POC (16 Nov) 19662 – IB singles mid (15 Nov) |
BankNifty Nov F: 44294 [ 44553 / 44205 ]

| Open Type |
|---|
| OA (Open Auction) |
| Volumes of 12,279 contracts |
| Initial Balance |
|---|
| 149 points (44409 – 44260) |
| Volumes of 27,116 contracts |
| Day Type |
|---|
| Neutral – 348 points |
| Volumes of 1,21,371 contracts |
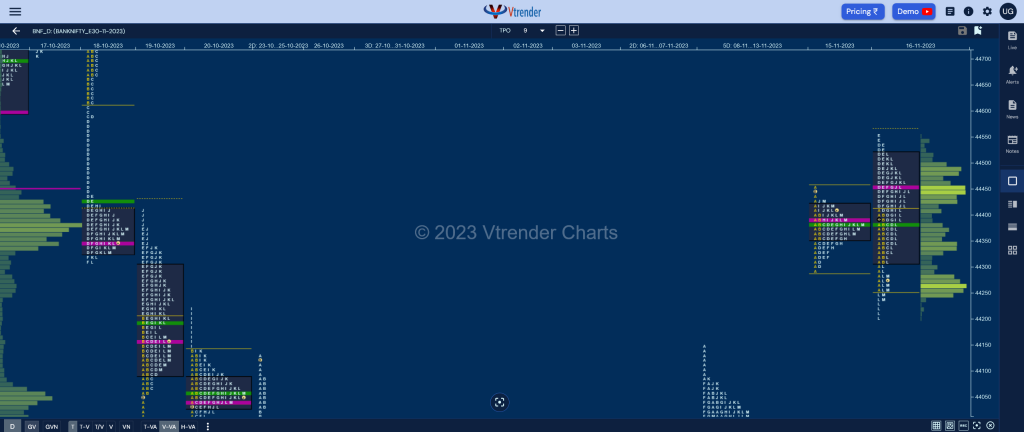
BNF opened in previous Value but could not get above it and made a look down below PDL making a low of 44260 and got rejected back resulting in new highs of 44409 at the close of A period after which it formed an inside bar in the B leaving a narrow 148 point range IB with a small buying tail at 44310 and consolidated further in C as it remained in a narrower 60 point range but stayed above day’s VWAP.
The auction then made a big RE (Range Extension) in the D TPO as it got into the DD zone from 18th Oct and scaled above the mid-point of 44530 and even made higher highs of 44553 in the E almost completing the 2 IB target for the day but could not extend any further leaving a small responsive selling tail and triggering a retracement down to VWAP as it left a PBL at 44390 in the G period.
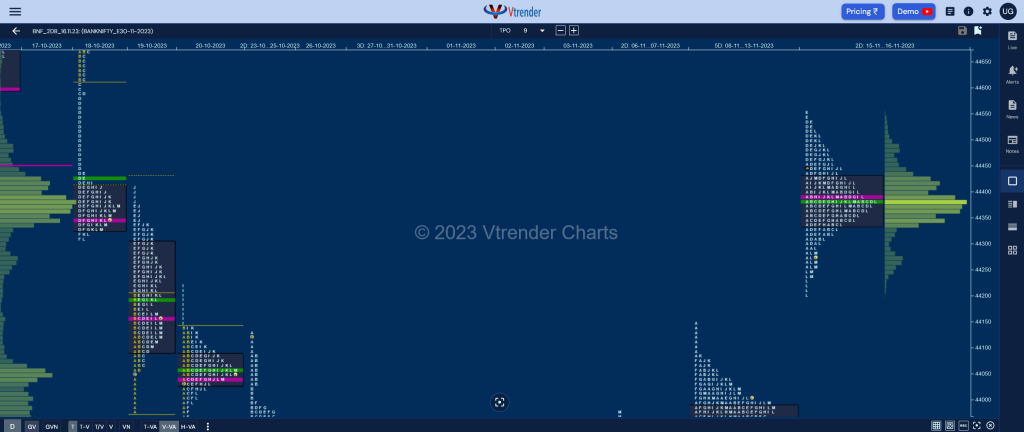
BNF made another similar PBL at 44392 in the I signalling that it may be getting ready for a final flourish into the close and even made an attempt to test the tail at top but could only manage to tag 44518 leaving a PBH there in the L TPO and this failure triggered a free fall as it not only broke below 44390 but went on to negate the A period buying tail even making new lows for the day at 44205 before closing around the HVN of 44262 leaving a Neutral Day and an outside bar both in terms of range & value which in turn is giving a nice 2-day Gaussian Curve with Value at 44339-44389-44431. (Click here to view the composite only on Vtrender Charts)

Click here to view the latest profile in BNF on Vtrender Charts
Daily Zones
- Largest volume (POC) was traded at 44459 F and VWAP of the session was at 44382
- Value zones (volume profile) are at 44311-44459-44515
- HVNs are at 42928 / 43184 / 43832** (** denotes series POC)
Monthly Zones
- The settlement day Roll Over point (November 2023) is 42564
- The VWAP & POC of Oct 2023 Series is 43718 & 44346 respectively
- The VWAP & POC of Sep 2023 Series is 44808 & 44438 respectively
- The VWAP & POC of Aug 2023 Series is 44493 & 44550 respectively
Business Areas for 17th Nov 2023
| Up |
| 44310 – SOC from 16 Nov 44431 – 2-day VAH (15-16 Nov) 44533 – Selling tail (16 Nov) 44620 – DD Ext Handle (18 Oct) 44774 – Selling Tail (18 Oct) |
| Down |
| 44262 – HVN from 16 Nov 44159 – Singles mid (15 Nov) 44082 – Weekly VWAP 43978 – Closing PBL (13 Nov) 43851 – Buying tail (13 Nov) |
You can check the monthly charts & other swing levels for both Nifty & BankNifty here & for the weekly charts & analysis, please click here.
