Nifty Mar F: 22135 [ 22219 / 22018 ]

| Open Type |
|---|
| OAIR (Open Auction In Range) |
| Volumes of 8,468 contracts |
| Initial Balance |
|---|
| 123 points (22123 – 22021) |
| Volumes of 30,349 contracts |
| Day Type |
|---|
| Neutral – 201 pts |
| Volumes of 1,18,534 contracts |
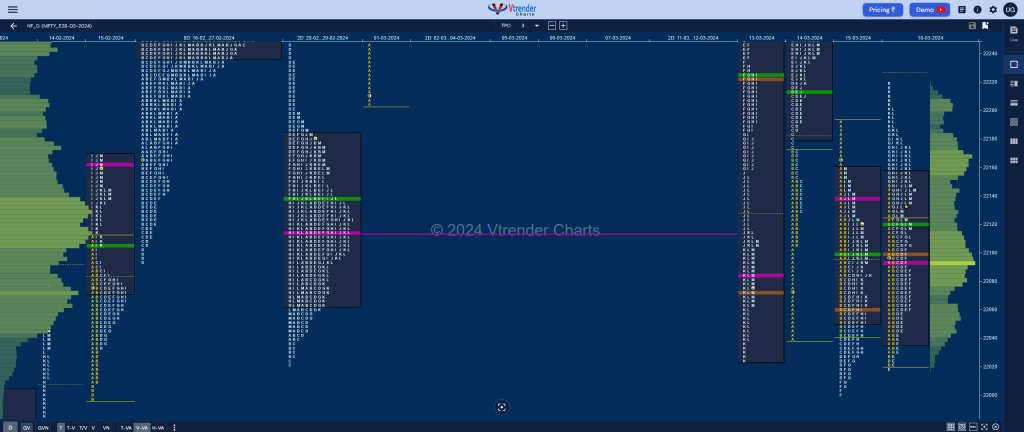
NF made an OAIR start on low volumes staying below yPOC of 22137 as it went on to make a low of 22021 in the B period and remained in previous value in the C & D TPOs before making an attempt to extend in the D where it made marginal new lows of 22018 but yet again found demand coming back at this swing reference of 22022 where it had left a FA (Failed Auction) on 29th Feb.
This swift rejection then led to a RE (Range Extension) higher in the G period confirming a new FA at lows but the auction then settled down into a narrow balance inside the range of G for rest of the day except for a fresh RE attempt it made in K TPO hitting new highs of 22219 but could not sustain above yVWAP of 22213 resulting in a quick retracement back to VWAP & IBL as it left a PBL (Pull Back Low) at 22112 in the L.
NF made a quiet close just above the IBH leaving a Neutral Day and an oustide bar both in terms of range as well as value with a FA at 22018 now being the new swing level to watch out for in the coming sessions for an imbalance taking over from balance.
Click here to view the latest profile in NF on Vtrender Charts
Daily Zones
- Largest volume (POC) was traded at 22094 F and VWAP of the session was at 22119
- Value zones (volume profile) are at 22036-22094-22157
- NF confirmed a FA at 22018 on 18/03 and the 1 ATR objective comes to 22229
- NF confirmed a FA at 22022 on 29/02 and completed the 2 ATR objective of 22456. This FA was tagged on 15/03 and saw some demand coming back so still a valid swing support.
- HVNs are at 22393 / 22443** / 22497 / 22596 (** denotes series POC)
Weekly Zones
- Weekly Charts can be viewed here
- (08-14 Mar) – NF has formed a Double Distribution Trend Down profile on the weekly as it left an initiative selling tail at previous week’s VAH and went on to probe lower swiping through the Value Areas of last couple of weeks tagging the 23-29 Feb’s VPOC of 22113 and made a low of 22025 taking support just above the daily FA of 22022 from 29th Feb. Value for the week was overlapping on both sides at 22286-22442-22593 with the VWAP at 22316 which will be the immediate supply point for the new week
- (01-07 Mar) – NF opened the week with an initiative probe to the upside right from the Mar RO point of 22188 as it left a buying tail from 22259 to 22180 and went on to record similar highs of 22547 & 22545 triggering a round of profit booking as it made a retracement down to 22322 taking support just above previous week’s VAH of 22293 and saw demand coming back resulting in a fresh imbalance and new ATH of 22620 but lack of fresh buying led to another round of profit booking as the auction came down to 22526 before closing the week at 22552 leaving a Normal Variation profile with completely higher Value at 22335-22443-22551 with the VWAP at 22452.
Monthly Zones
- The settlement day Roll Over point (March 2024) is 22188
- The VWAP & POC of Feb 2024 Series is 21956 & 21930 respectively
- The VWAP & POC of Jan 2024 Series is 21581 & 21635 respectively
- The VWAP & POC of Dec 2023 Series is 21226 & 21377 respectively
Business Areas for 19th Mar 2024
| Up |
| 22138 – 2-day POC (15-18 Mar) 22188 – Mar RO Point 22229 – 1 ATR (FA 22018) 22266 – VPOC (14 Mar) 22301 – G TPO VWAP (14 Mar) 22333 – Ext Handle (13 Mar) |
| Down |
| 22119 – VWAP (18 Mar) 22088 – SOC (18 Mar) 22054 – E TPO VWAP 22018 – FA (18 Mar) 21983 – K TPO VWAP (14 Feb) 21936 – Ext Handle (14 Feb) |
BankNifty Mar F: 46741 [ 46900 / 46210 ]

| Open Type |
|---|
| OAIR (Open Auction In Range) |
| Volumes of 10,282 contracts |
| Initial Balance |
|---|
| 327 points (46802 – 46475) |
| Volumes of 36,975 contracts |
| Day Type |
|---|
| Neutral – 690 points |
| Volumes of 1,58,501 contracts |
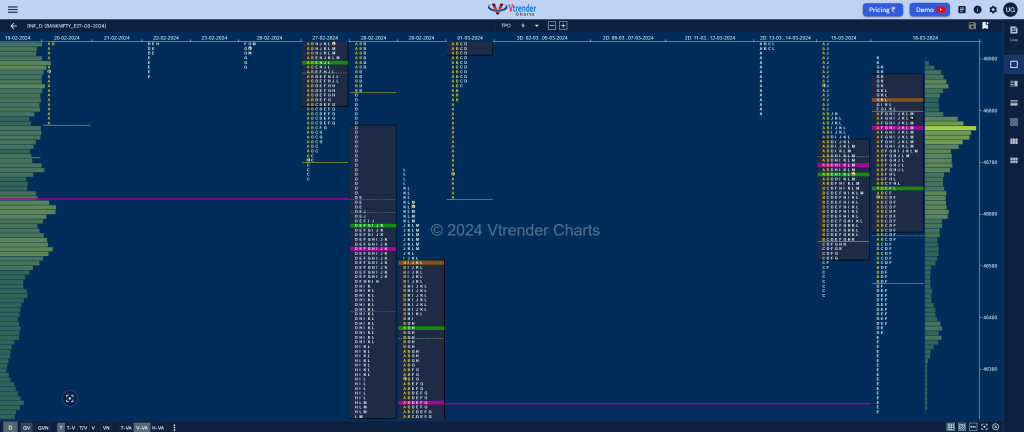
BNF opened below 46699 and made a probe higher to 46802 but the move out of previous Value got rejected as it went on to swipe back in previous balance completing the 80% Rule and making a low of 46475 in the B period.
The auction then made a RE lower in the D hitting the expected objective of 46383 (VWAP from 29th Feb) and continued the imbalance in the E where it tagged that day’s VPOC of 46241 while making a low of 46210 and saw a mix of short covering plus buying happening as it left a long responsive buying tail till 46375 marking the end of the downside.
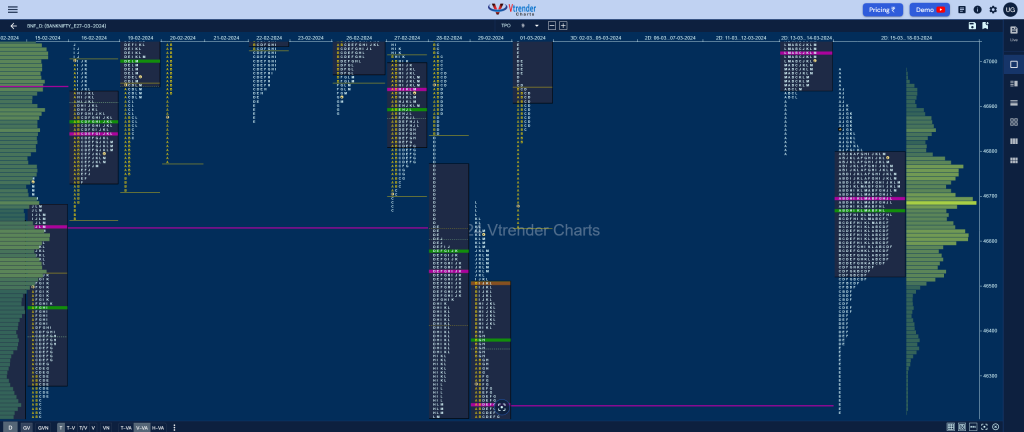
BNF then made couple of attempts to extend higher in the G & K periods but could only manage to leave similar highs of 46889 & 46900 and made a close around the POC of 46771 leaving a Neutral Day with overlapping value giving a 2-day composite with value at 46525-46699-46793 with rejection at both extremes so will need to see if this balance continues or gives way to a fresh imbalance in the coming session(s).

Click here to view the latest profile in BNF on Vtrender Charts
Daily Zones
- Largest volume (POC) was traded at 46771 F and VWAP of the session was at 46652
- Value zones (volume profile) are at 46567-46771-46865
- BNF confirmed a FA at 47684 on 13/03 and tagged the 2 ATR objective of 464427 on 15/03. This FA is currently on ‘T+4’ Days
- HVNs are at 47521** / 48217 (** denotes series POC)
Weekly Zones
- Weekly Charts can be viewed here
- (07-14 Mar) – BNF has formed an inside bar on the weekly with overlapping to lower value at 47000-47518-47593 and is a Trend Down one which has moved away to the downside from the prominent POC of 47518 so this week’s VWAP of 47600 will now be the swing reference for the coming week
- (01-06 Mar) – BNF left a Trend Up weekly profile hitting the 2 IB target of 48343 forming completely higher value at 47444-47567-48229 with a closing HVN at 48217 which will be the immediate reference on the upside in the coming week staying above which it could go for the higher VPOC of 48480 and HVN of 48864 from the weekly profile of 11th to 17th Jan whereas on the downside, this week’s VWAP of 47694 will be an important swing support.
Monthly Zones
- The settlement day Roll Over point (March 2024) is 46610
- The VWAP & POC of Feb 2024 Series is 46119 & 45700 respectively
- The VWAP & POC of Jan 2024 Series is 46353 & 48119 respectively
- The VWAP & POC of Dec 2023 Series is 47337 & 47918 respectively
Business Areas for 19th Mar 2024
| Up |
| 46771 – POC (18 Mar) 46852 – K TPO POC 46940 – A TPO POC (15 Mar) 47024 – VPOC (14 Mar) 47199 – I TPO halfback (14 Mar) 47335 – G TPO VWAP (14 Mar) |
| Down |
| 46710 – M TPO low 46598 – F TPO halfback 46455 – SOC (18 Mar) 46338 – E TPO halfback 46210 – PDL 46119 – Feb series VWAP |
You can check the monthly charts & other swing levels for both Nifty & BankNifty here & for the weekly charts & analysis, please click here.
