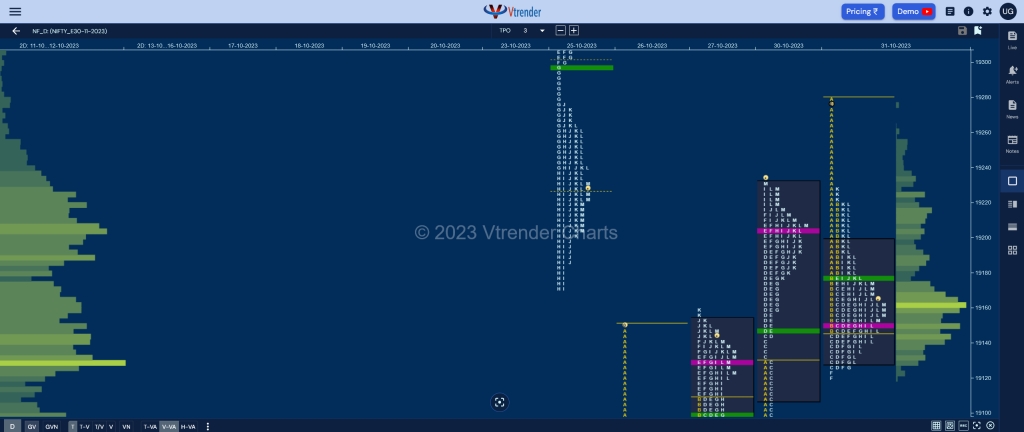
Nifty Nov F: 19158 [ 19279 / 19120 ]

| Open Type |
|---|
| ORR (Open Rejection Reverse) |
| Volumes of 16,951 contracts |
| Initial Balance |
|---|
| 131 points (19279 – 19148) |
| Volumes of 39,907 contracts |
| Day Type |
|---|
| Normal (‘b’ shape) – 159 points |
| Volumes of 1,25,003 contracts |
NF made a higher open right at 25th Oct’s PBH of 19275 but could only manage to tag 19279 and swiftly got back into previous day’s range & value confirming an Open Rejection Reverse as it left an extension handle at 19181 and went on to hit 19148 in the B period which was followed by a good C side RE which tested the DD extension handle of 19130 while making new lows of 19126.
The auction then put up marginal new lows of 19125 in the D TPO indicating supply drying up in this zone triggering a bounce back to day’s VWAP in the E where it hit 19178 stalling just below the morning handle of 19181 which meant that the sellers were defending this zone resulting in a fresh prode lower in the F period which even saw new lows of 19120 but once again there was no fresh supply coming in.
It became clear that NF had got into a 2-way auction as it made a slow probe back to VWAP even looking up above 19181 in the I TPO as it made a high of 19191 showing that the sellers have stepped back a bit and this encouraged some more demand into the auction as the K period made higher highs even getting into the A period selling tail but stalled at 19227 unable to get above PDH which marked the re-entry of aggressive supply who then pushed it down to 19130 in the L before closing around the POC to leave a ‘b’ shape profile & a Normal Day with completely inside Value.
Click here to view the latest profile in NF on Vtrender Charts
Daily Zones
- Largest volume (POC) was traded at 19150 F and VWAP of the session was at 19178
- Value zones (volume profile) are at 19130-19150-19198
- HVNs are at 19062 / 19129 / 19392 (** denotes series POC)
Monthly Zones
- The settlement day Roll Over point (November 2023) is 18964
- The VWAP & POC of Oct 2023 Series is 19568 & 19537 respectively
- The VWAP & POC of Sep 2023 Series is 19736 & 19672 respectively
- The VWAP & POC of Aug 2023 Series is 19440 & 19424 respectively
Business Areas for 01st Nov 2023
| Up |
| 19178 – VWAP (31 Oct) 19235 – A TPO POC (31 Oct) 19275 – PBH (25 Oct) 19326 – G TPO POC (25 Oct) 19357 – Ext Handle (25 Oct) |
| Down |
| 19130 – PBL (31-Oct) 19094 – SOC (30 Oct) 19048 – B TPO VWAP (30 Oct) 18990 – Buy Tail low (27 Oct) 18964 – VPOC (26 Oct) |
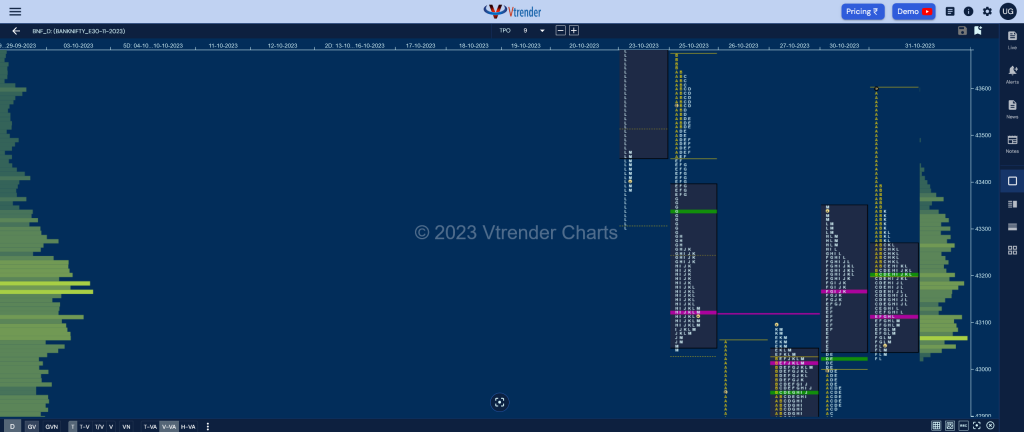
BankNifty Nov F: 43076 [ 43603 / 43020 ]

| Open Type |
|---|
| ORR (Open Rejection Reverse) |
| Volumes of 15,479 contracts |
| Initial Balance |
|---|
| 304 points (43506 – 43202) |
| Volumes of 39,566 contracts |
| Day Type |
|---|
| Normal Variation (‘b’ shape) – 583 points |
| Volumes of 1,66,017 contracts |
BNF opened higher with a freak tick at 43603 and failed to get any fresh demand triggering a probe back into previous day’s range & value as it left an initiative selling tail till 43389 in the Initial Balance and went on to complete the 80% Rule with the help of 3 range extensions lower in the C, E & F periods where it tested DD’s extension handle of 43030 while making a low of 43020.
The auction however did not find any supply at the lows resulting in the reverse 80% Rule playing out from the G to the K TPO where it made a high of 43342 stalling just below previous VAH paving way for another rotation to the downside into the close as it went on to hit 43025 leaving poor lows and a ‘b’ shape profile with Value completely inside filling up the DD zone of yesterday.
BNF has a good chance of moving away from this balance in the coming session but will need initiative activity at either end of today’s Value and acceptence below 43027 or above 43389 for a further move in that direction
Click here to view the latest profile in BNF on Vtrender Charts
Daily Zones
- Largest volume (POC) was traded at 43114 F and VWAP of the session was at 43201
- Value zones (volume profile) are at 43042-43114-43268
- HVNs are at 42929 / 43184 / 44040 (** denotes series POC)
Monthly Zones
- The settlement day Roll Over point (November 2023) is 42564
- The VWAP & POC of Oct 2023 Series is 43860 & 44346 respectively
- The VWAP & POC of Sep 2023 Series is 44808 & 44438 respectively
- The VWAP & POC of Aug 2023 Series is 44493 & 44550 respectively
Business Areas for 01st Nov 2023
| Up |
| 43114 – dPOC from 31 Oct 43268 – VAH from 31 Oct 43389 – Selling Tail (31 Oct) 43496 – IB singles mid (31 Oct) 43560 – SOC (25 Oct) |
| Down |
| 43042 – VAL from 31 Oct 42898 – C TPO POC (30 Oct) 42750 – SOC from 30 Oct 42623 – Swing Low (30 Oct) 42564 – VPOC (26 Oct) |
You can check the monthly charts & other swing levels for both Nifty & BankNifty here & for the weekly charts & analysis, please click here.
