Market Profile Analysis dated 15th November
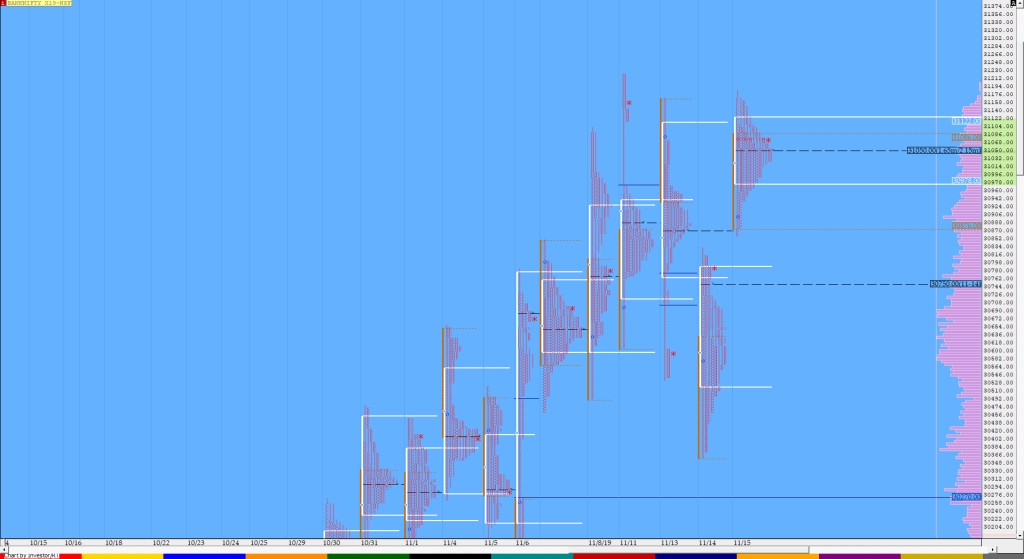
Nifty Nov F: 11943 [ 12009/ 11913 ] HVNs – 11667 / 11760 / 11814 / 11901 / 11935 / 11980 Previous day’s report ended with this ‘the auction is not finding aggressive sellers after moving lower from the 5-day composite hence can attempt a move back into the higher composite Value of 11933-11979-12009‘ NF opened […]
Weekly charts (11th to 15th November) and Market Profile Analysis
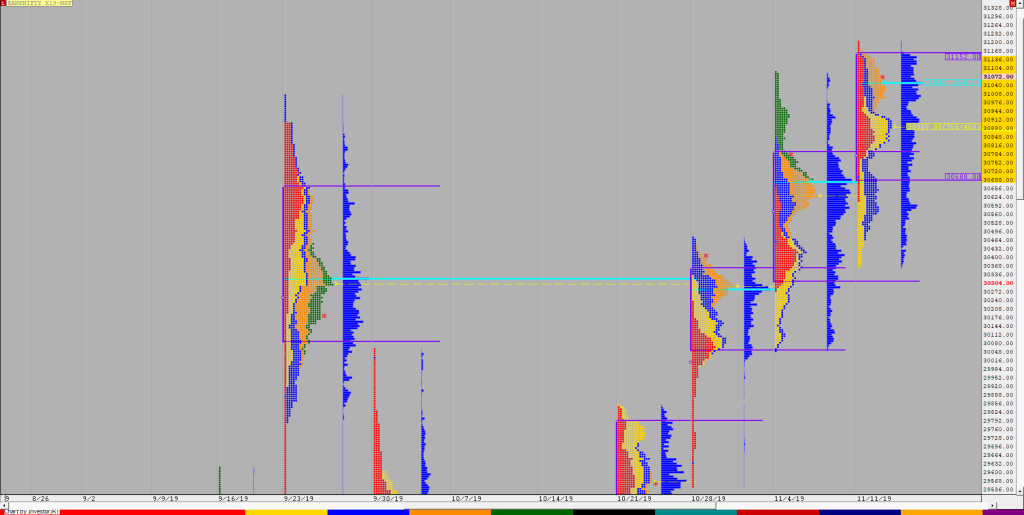
Nifty Spot Weekly Profile (11th to 15th November) Spot Weekly 11895 [ 11974 / 11802 ] Nifty did not give that big move away from previous week’s Gaussian profile as was expected in previous week’s report though it stayed below previous week’s POC of 11968 and also got accepted below 11880 as the downside probe […]
Order Flow charts dated 15th Nov
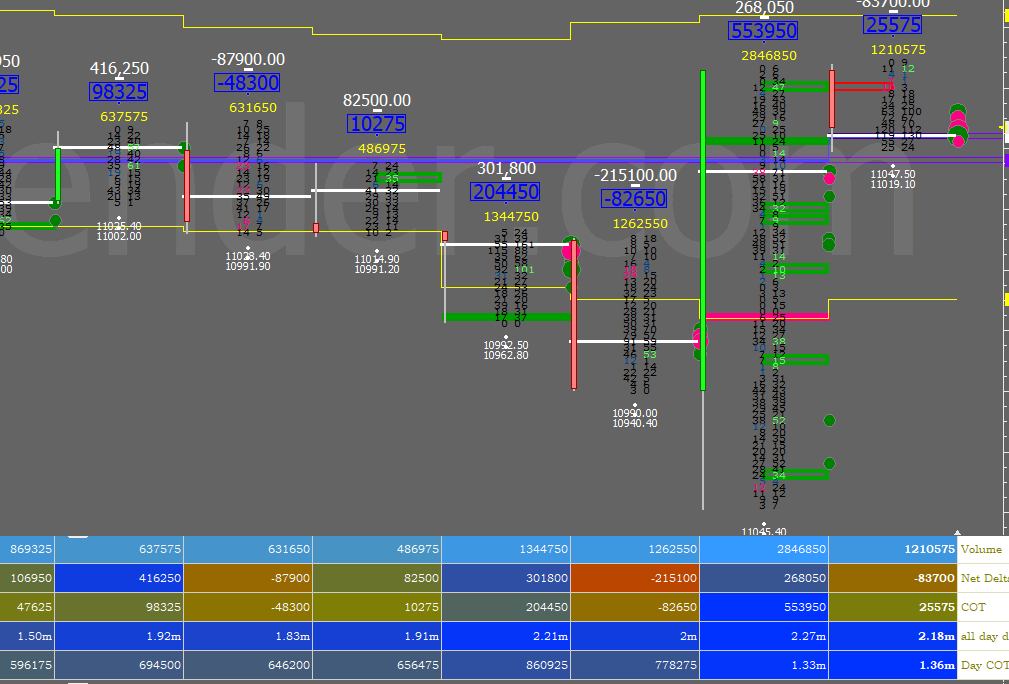
Many traders are looking for information on how to use market conditions to find good trades. Order Flow is best understood as a way to see existing bias in the markets. Order Flow helps us understand who is in control of the market and who is ‘upside down’ and likely to make exits from that […]
Order Flow charts dated 15th Nov (5 mins)
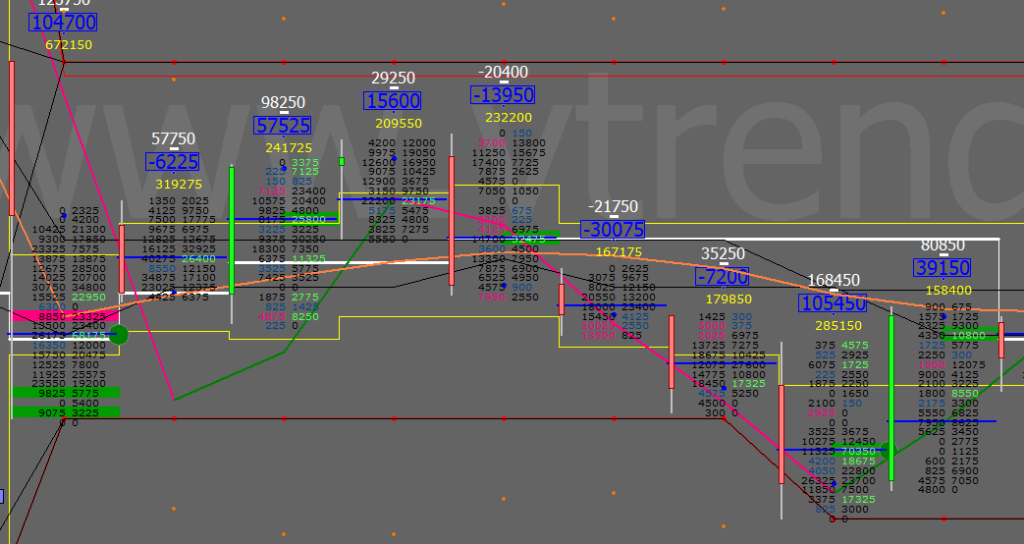
An Order Flow trader can actually see exactly what is happening in the market as it happens. Once you are able to understand what is happening in the present, you are able to make far better decisions about what might happen in the future. Order Flow provides traders with vision into market activity. NF BNF
Market Profile Analysis dated 14th November
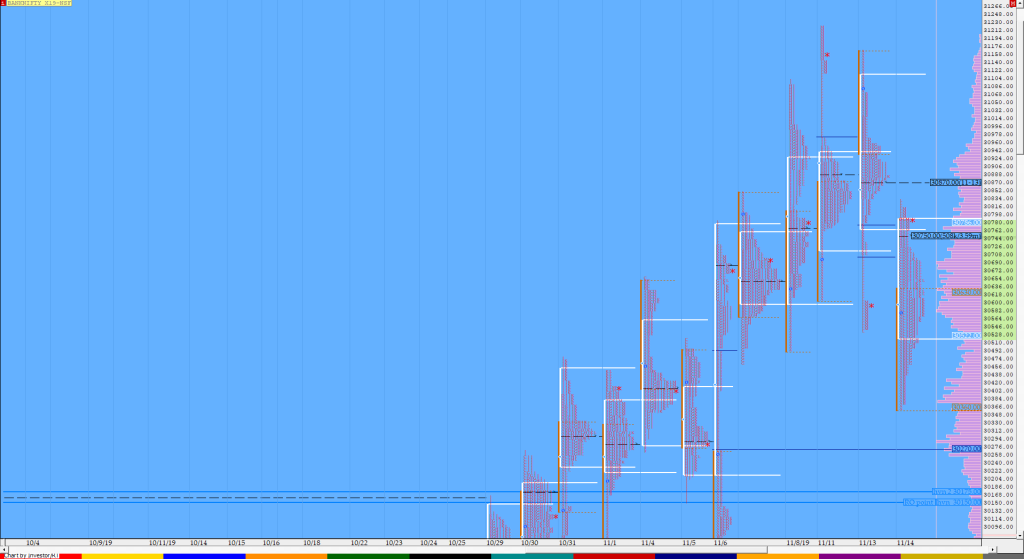
Nifty Nov F: 11863 [ 11957/ 11846 ] HVNs – 11667 / 11814 / 11860 / 11905 / 11980 / 12003 NF gave a Open Rejection Reverse (ORR) start to the downside as it got rejected on a probe above the spike high leaving a high of 11887 just below that extension handle of 11897 indicating […]
Order Flow charts dated 14th Nov

Many traders are used to viewing volume as a histogram beneath a price chart. But the Order Flow approach shows the amount of volume traded during each price bar, and also it breaks this volume down into the Volume generated by the Buyers and the Volume generated by the sellers again at every row of […]
Order Flow charts dated 14th Nov (5 mins)

Order Flow is the most transparent way to trade and takes away the guesswork from decision making. NF BNF
Market Profile Analysis dated 13th November
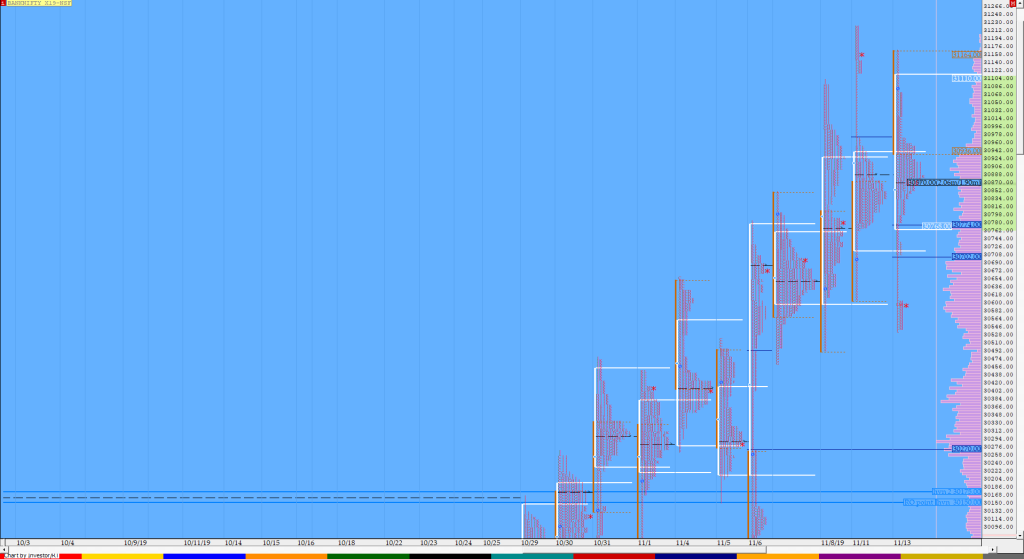
Nifty Nov F: 11863 [ 11957/ 11846 ] HVNs – 11667 / 11814 / 11860 / 11905 / 11980 / 12003 NF opened below the Neutral Extreme low of 11932 but took support just above the yPOC of 11904 as it made a low of 11908 in the opening minutes and probed higher entering into the […]
Order Flow charts dated 13th Nov

When we think about how to measure volume in the market one of the keys is Order Flow. It plays a role by telling us what the other traders have done in the market and are currently doing and this provides valuable clues and potential opportunities to trade. An Order Flow trader can actually see […]
Order Flow charts dated 13th Nov (5 mins)

Vtrender helps you to stay on top of the Market by understanding Order Flow. This increases your flexibility, your data analysis capability and your winning trade signals. And you make your existing systems better. NF BNF
