When You See What Others Don't — You Trade How Others Can't.
Discover institutional footprints, hidden auctions, and volume pressure — in real time.
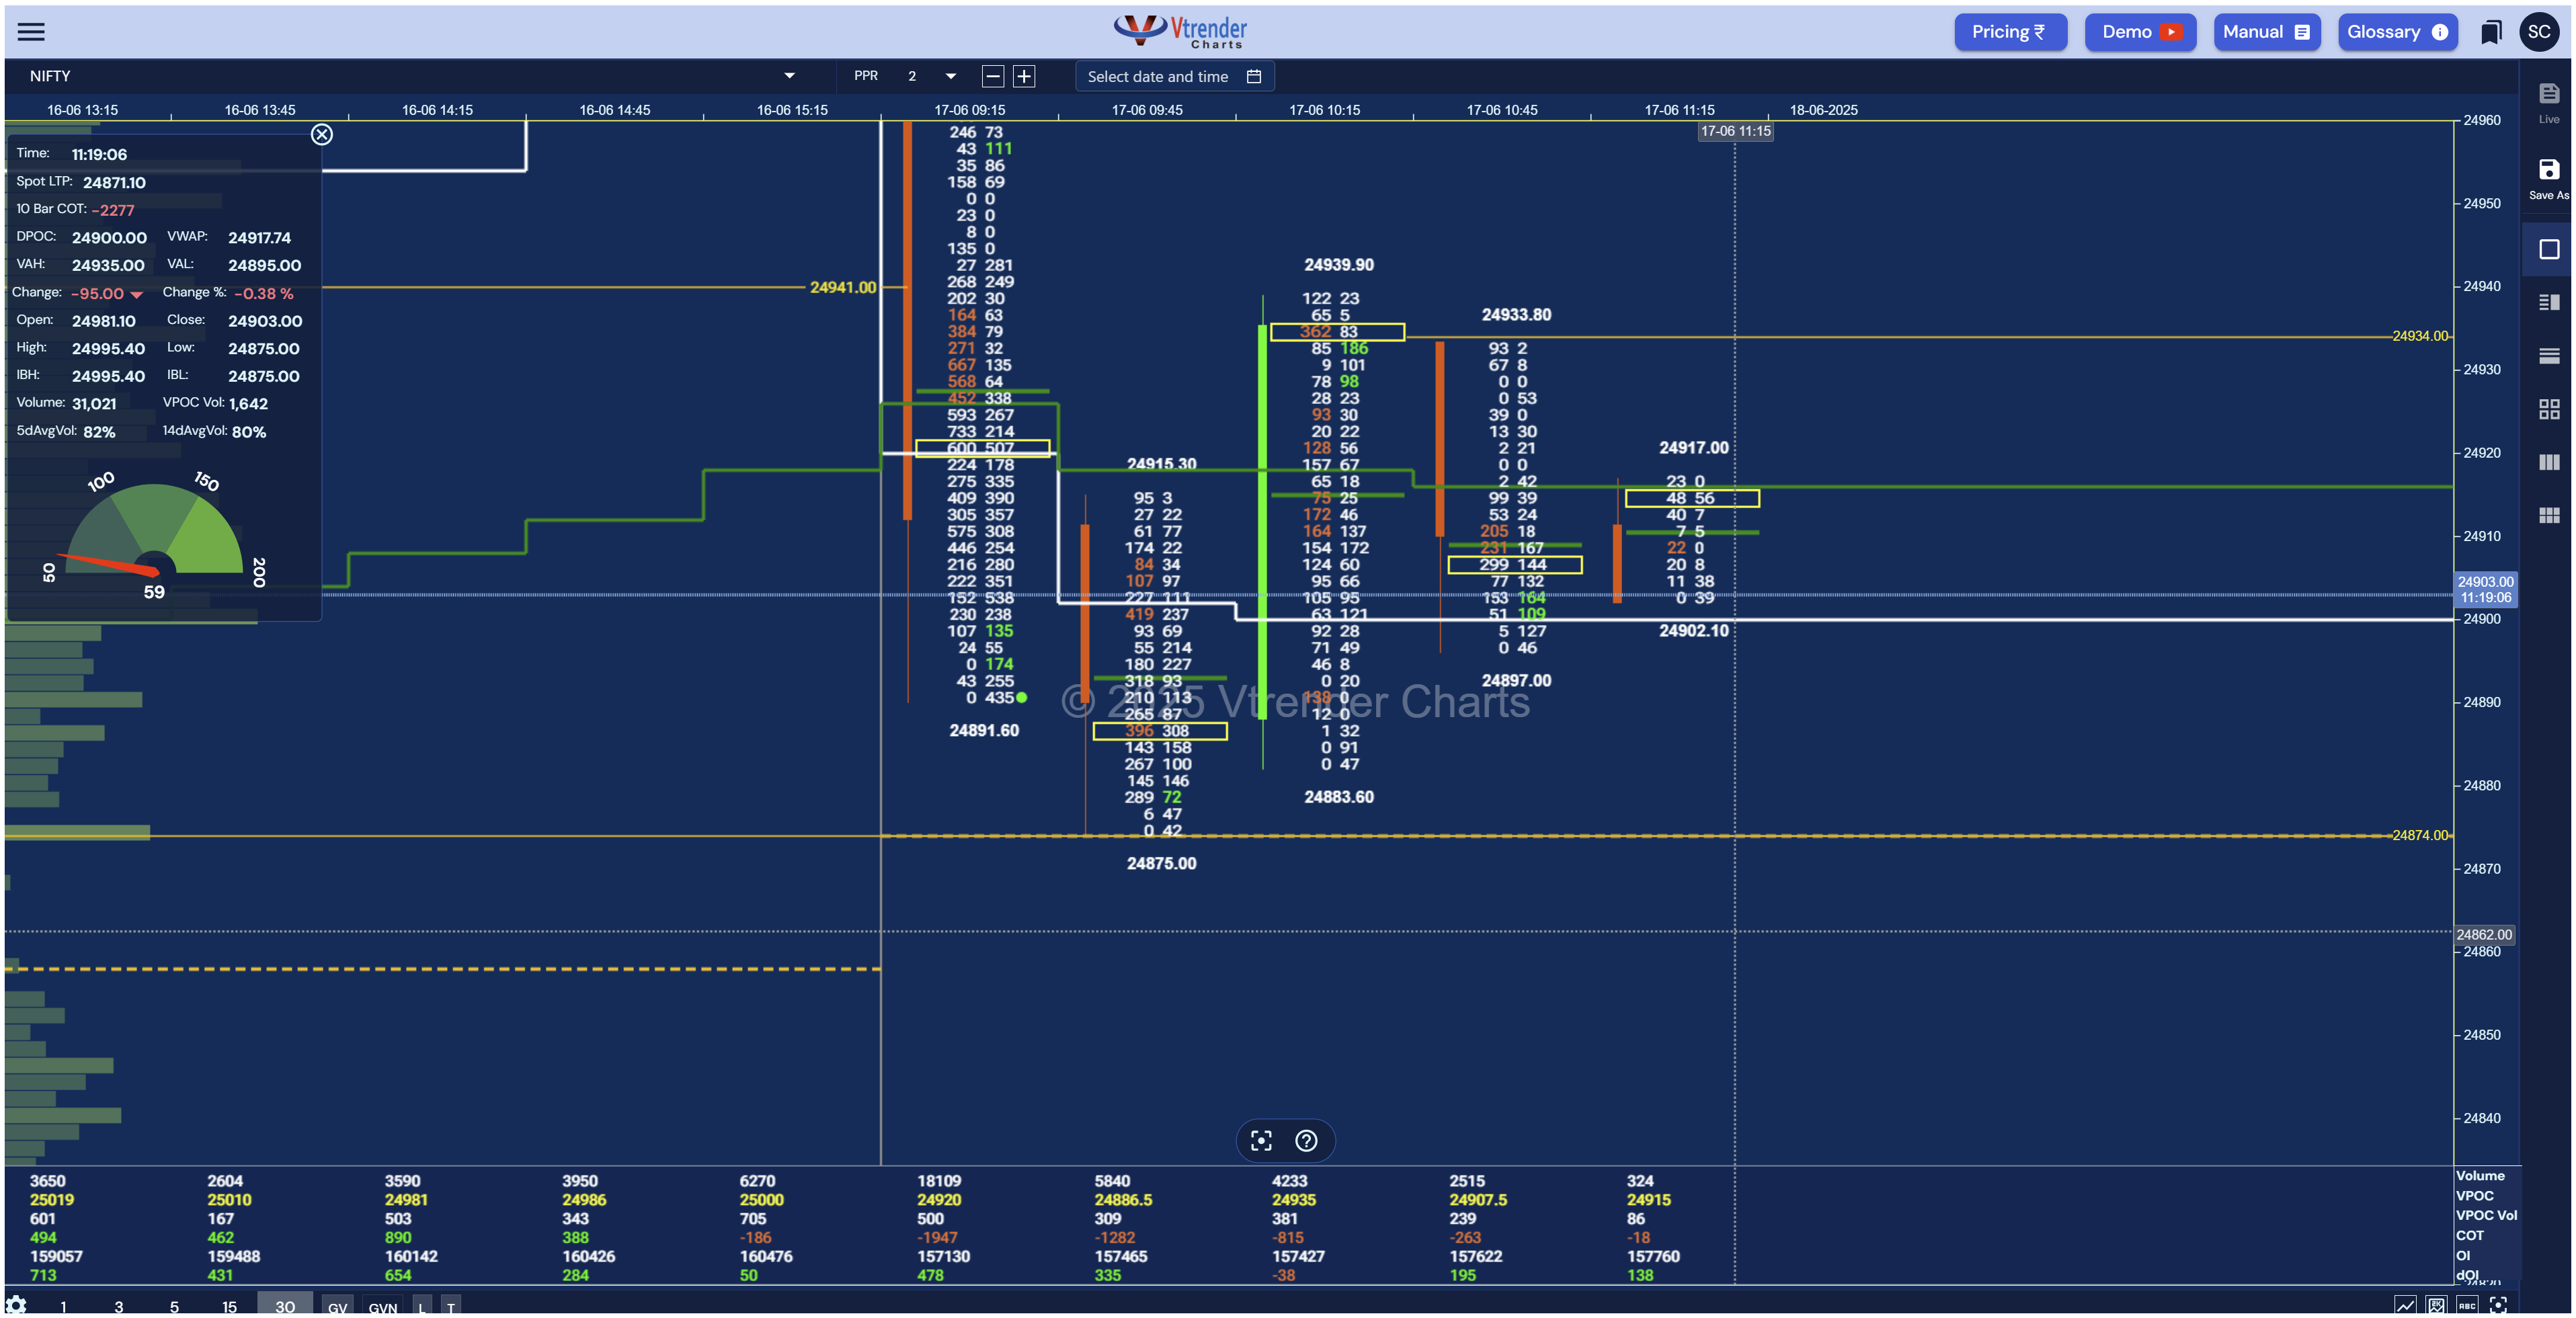
Start Streaming Charts NowAdvanced Analytics.
Simplified Interface.
Real-time NSE data. Zero delays. No noise.
Every tool you need to read the market — exactly as it
unfolds.
Six Reading Layers. One Platform.
Each tool answers a question your price chart leaves open.
Built for Traders Who Read
the Market as a Process
Not for tips. Not for signals. For traders who want to understand what is actually happening.
Vtrender is not built for tip-seekers. It is built for traders who want to understand what they are trading.
Start Free. Upgrade When You're Ready.
The free plan gives you live Market Profile for NIFTY and BANKNIFTY. The full suite unlocks every reading layer.
- Market Profile charts — NIFTY, BANKNIFTY, Sensex, Bankex
- Live and historical sessions
- Value Area, POC, Initial Balance
- Basic Order Flow view
- Session replay
- Everything in the free plan
- Complete Order Flow — delta, COT, IB/IS, footprint
- Gamma Density and Gamma Exposure charts
- Spectrum — options writer positioning map
- NTM VolX — real-time near-the-money control
- MFLOW 2.0 — new vs old business, live
- Smart Candlesticks with MFlow & MB boxes
- Full options suite — IV Smile, Greeks, OI, FII data
See full plan details and pricing on the subscription page →
The Methodology Behind the Charts
Both resources are built around Vtrender Charts — for traders who want to understand the framework behind every tool they use.
Built around Vtrender Charts. Learn what each tool is showing you and exactly why it matters.
DRM-free PDF. Read it alongside your charts. Mark it up. Print it. It's yours.
How the Tools Apply to Real Sessions
Written by the Vtrender Research Desk. No tips. No predictions. How the reading actually works.
Most charts tell you
what happened.
Vtrender Charts tells you
what is happening.
Start with the free plan. Market Profile live on day one. No credit card.
Observe. Do not predict.