
Love Vtrender Charts? Check out our new offer!
Nifty Spot: 25471 [ 26009 / 25444 ] Neutral Extreme (Down)
Previous week’s report ended with this ‘The weekly profile is an elongated 1662 point range Double Distribution one with a daily FA at lows of 24679 and a zone of singles from 25108 to 25491 which will be the support going forward but also left a long responsive selling tail from 25863 to 26341 for the buyers to negotiate in the coming week as the Value was completely higher and a well balanced one at 25505-25782-25855'
New to Market Profile? Start here: |
|---|
• Market Profile basics: https://vtrender.com/pillar/market-profile |
09 Feb (Monday) - 25867 [ 25922 / 25780 ] Normal
10 Feb Tuesday - 25935 [ 25989 / 25870 ] Normal
11 Feb (Wednesday) - 25953 [ 26009 / 25899 ] Normal
12 Feb (Thursday) - 25807 [ 25906 / 25752 ] Normal Variation (Down)
13 Feb (Friday) - 25471 [ 25630 / 25444 ] Normal Variation (Down)
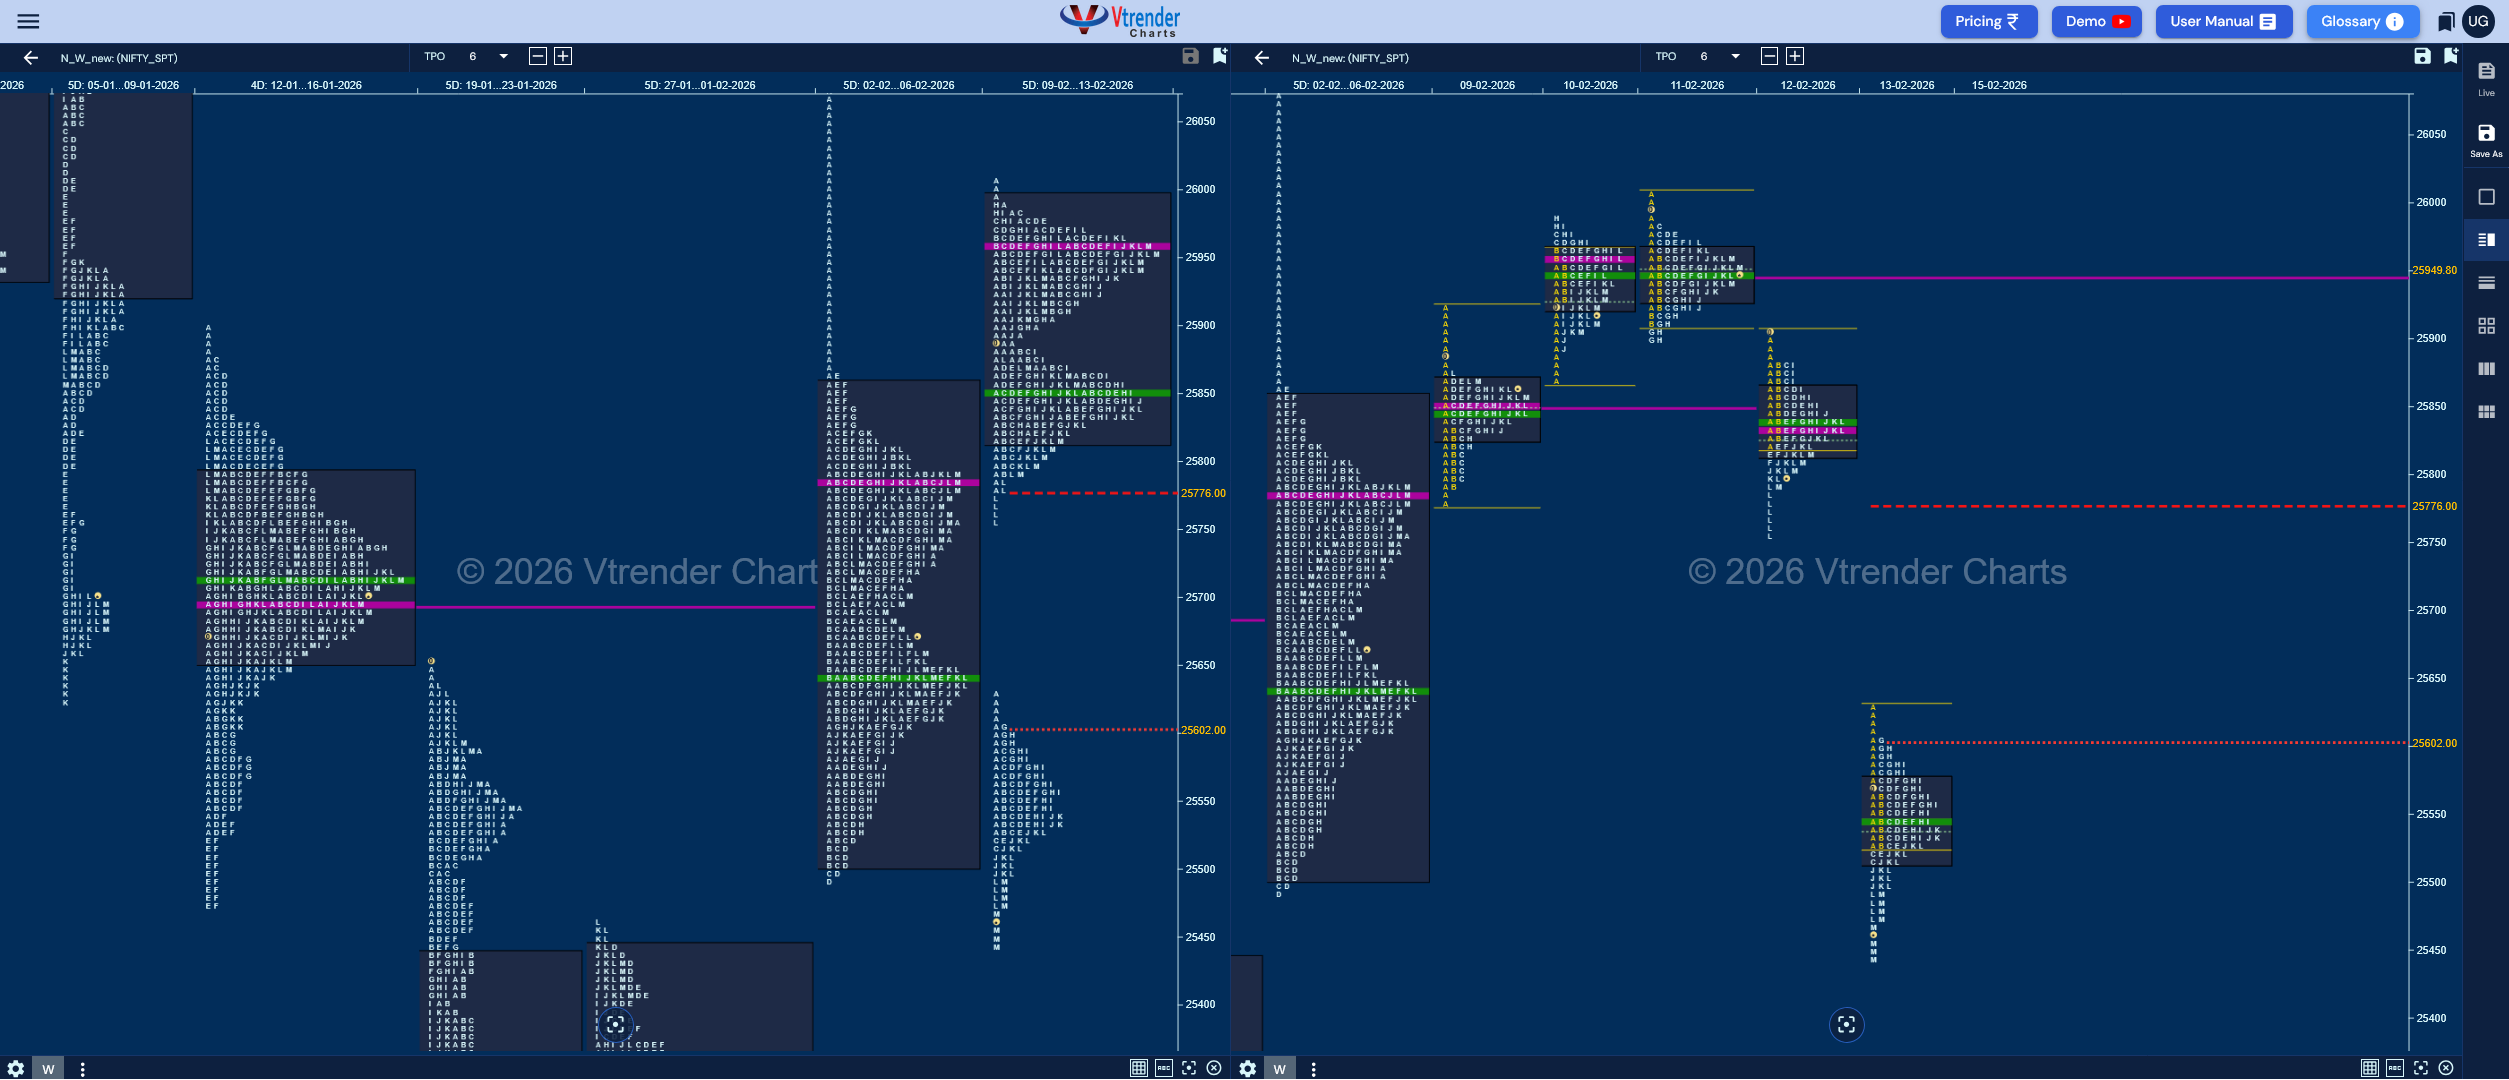
Nifty opened the week with a gap up of almost 200 points on Monday but the probe into previous week's singles stalled right at the important 2025 HVN of 25922 as it came back lower to test the prominent POC of 25782 while making a low of 25780 leaving a small but important buying tail triggering a move higher to 25989 on Tuesday and saw a higher open on Wednesday which saw aggressive selling coming back as seen in the A period tail from 26009 to 25980 marking the end of the upside.
The auction then opened with a gap down in the next 2 sessions leaving initiative selling tails on both days as it not only broke below 25780 decisively but went on to test last week singles zone from 25491 to 25108 while making a low of 25444 holding just above the extension handle of 25440.
This week's structure is a Neutral Extreme One to the downside with mostly higher Value at 25813-25957-25994 from where it has moved away with a zone of singles from 25780 to 25606 even negating the daily FA of 25491 which could now show change of polarity in the next week for a test of the developing 2026 POC of 25275 along with the SOC at 25108 below which could drop further to the 02nd Feb extension handle of 25984 and VPOC of 24863.
Click here to view this week’s MarketProfile of Nifty on Vtrender Charts
All the Charts and Tools available at charts.vtrender.com
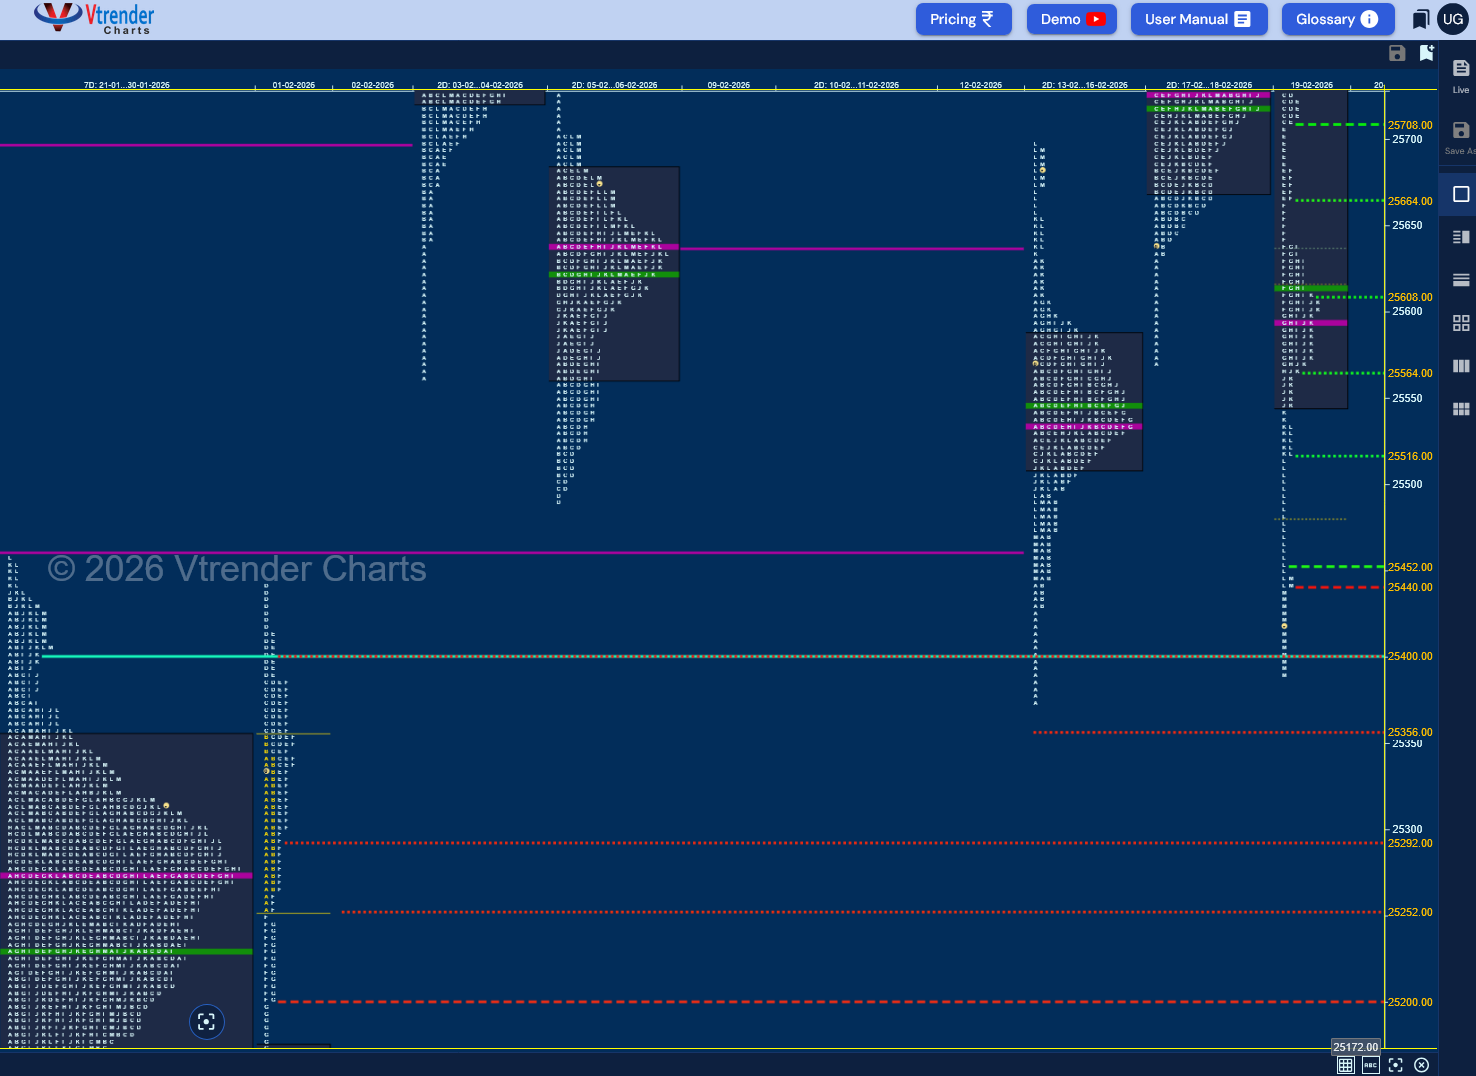
16 Feb (Monday) - 25682 [ 25697 / 25372 ] Outside Bar
17 Feb (Tuesday) - 25725 [ 25764 / 25570 ] Normal Variation (Up)
18 Feb (Wednesday) - 25819 [ 25829 / 25645 ] Neutral Extreme (Up)
19 Feb (Thursday) - 25454 [ 25885 / 25388 ] Trend (Down)
Up |
|---|
25454 - Prev Close 25518 - Ext Handle (19 Feb) 25564 - K TPO h/b (19 Feb) 25610 - PBH (19 Feb) 25667 - Ext Handle (19 Feb) 25708 - Ext Handle (19 Feb) |
Down |
|---|
25440 - Tail (19 Feb) 25400 - Feb RO point 25357 - 1 ATR (FA 25645) 25294 - F TPO h/b (01 Feb) 25252 - Ext Handle (01 Feb) 25203 - PBH (01 Feb) |
WhatsApp me (Uttam Goel) on +91 90362 79747 if you need more information
BankNifty Spot: 60186 [ 60876 / 60073 ] Normal Variation (Down)
Previous week’s report ended with this 'The weekly profile in BankNifty also resembles a Double Distribution one to the upside with the DD zone from 58687 to 59659 and overlapping to higher Value in a well balanced zone from 59644-60172-60707 not to forget the towering sell side singles from 60389 to 61764'
09 Feb (Monday) - 60669 [ 60876 / 60495 ] Normal
10 Feb (Tuesday) - 60626 [ 60797 / 60531 ] Normal (Inside Bar)
11 Feb (Wednesday) - 60745 [ 60780 / 60444 ] Normal Variation (Up)
12 Feb (Thursday) - 60739 [ 60864 / 60597 ] Neutral
13 Feb (Friday) - 60186 [ 60621 / 60073 ] Normal Variation (Down)
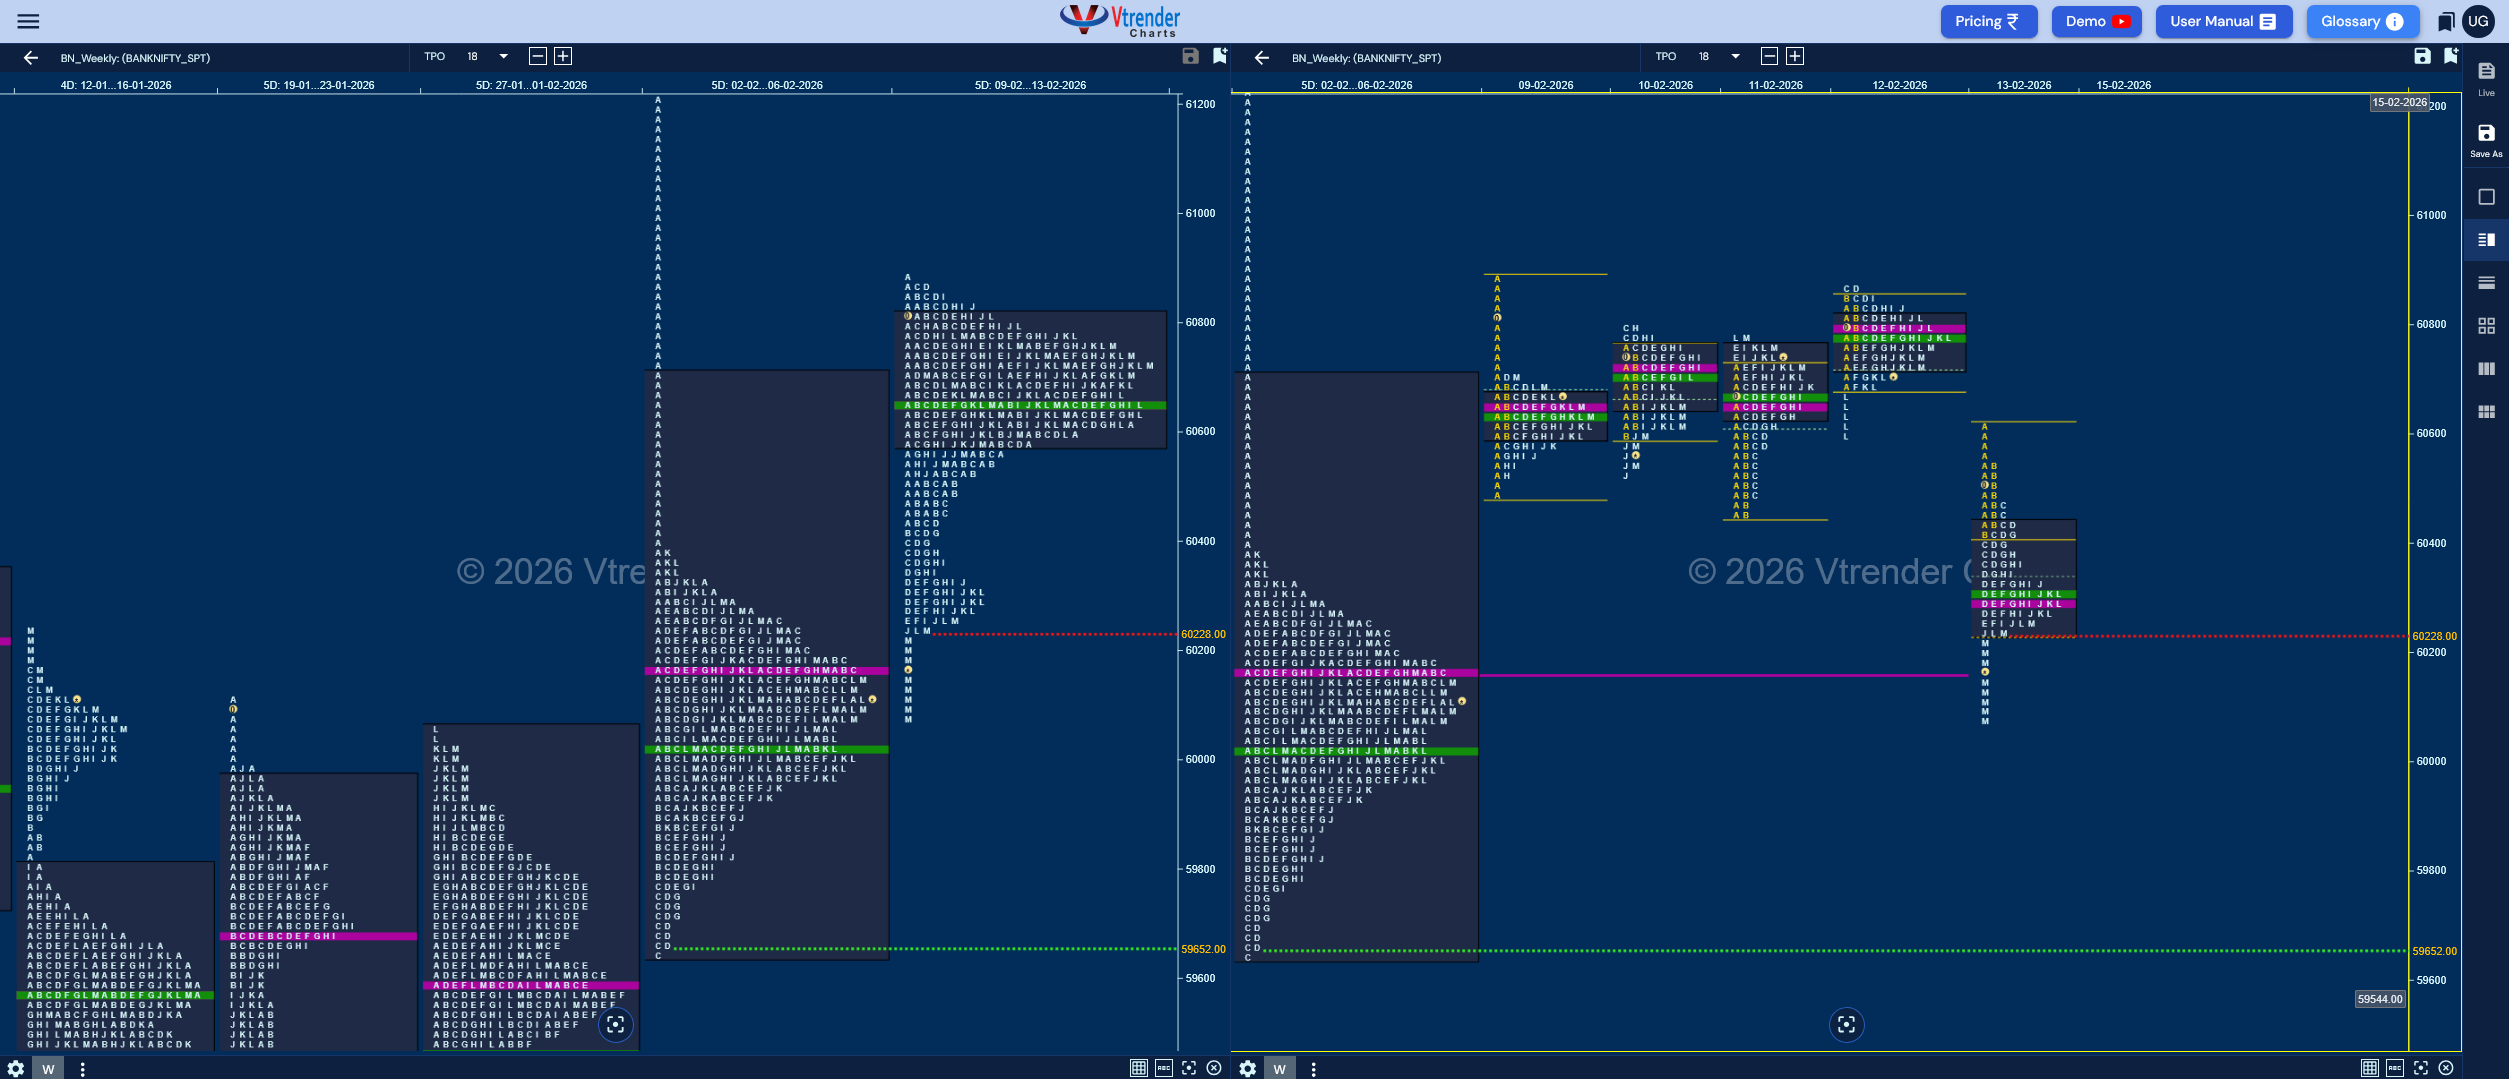
BankNifty opened the week with a big gap up well above previous week's supply zone from 60389 but left a fresh initiative selling tail at 60876 forming a Normal Day and a 'b' shape profile after which it remained largely in Monday's range over the next 3 sessions accumulating a 4-day Gaussian Curve with a FA at 60864 on Thursday signalling the failure of buyers.
The auction then saw the sellers take complete control with a move away on Friday with not just a lower open but move back to previous week's prominent POC and magnet of 60172 with a spike into the close leaving a Normal Variation weekly structure to the downside with overlapping to higher Value at 60572-60651-60808 with a spike zone from 60233 to 60073 which will be the reference for the next week.
Click here to view this week’s MarketProfile of BankNifty on Vtrender Charts
All the Charts and Tools available at charts.vtrender.com
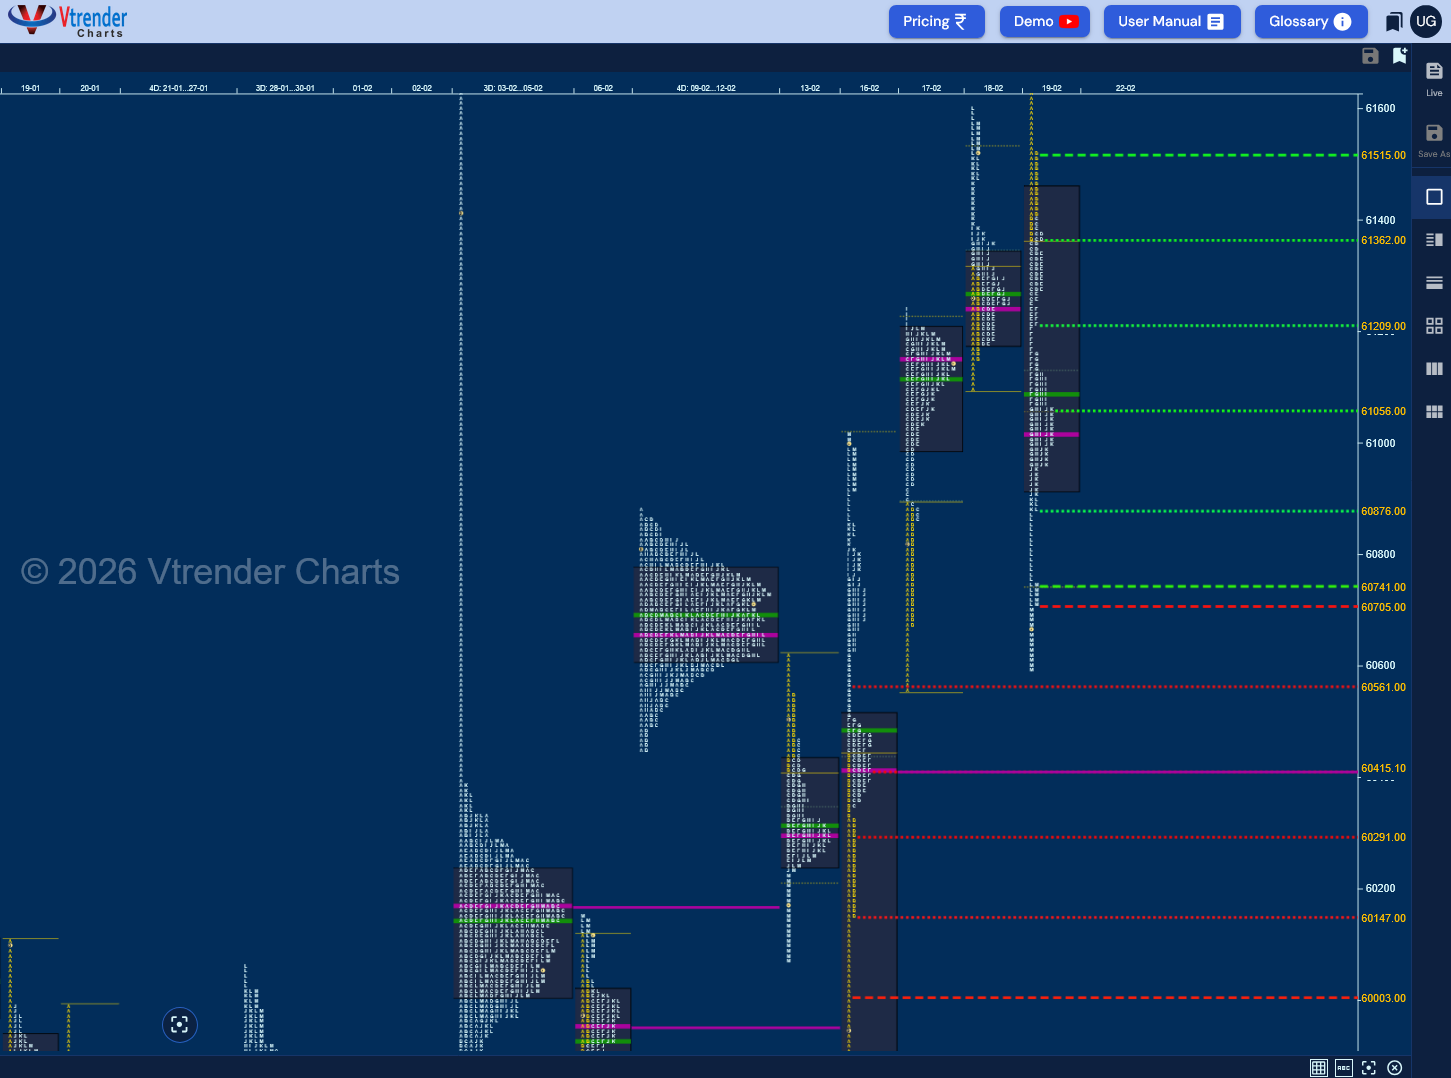
16 Feb (Monday) - 60949 [ 61011 / 59861 ] Trend (Up)
17 Feb (Tuesday) - 61174 [ 61241 / 60560 ] Normal Variation (Up)
18 Feb (Wednesday) - 61550 [ 61596 / 61100 ] Normal Variation (Up)
19 Feb (Thursday) - 60739 [ 61678 / 60592 ] Trend (Down)
Up |
|---|
60741 - M TPO high (19 Feb) 60877 - Ext Handle (19 Feb) 61061 - PBH (19 Feb) 61210 - Ext Handle (19 Feb) 61369 - IBL (19 Feb) 61519 - Sell Tail (19 Feb) |
Down |
|---|
60710 - Tail (19 Feb) 60563 - DD tail mid (16 Feb) 60415 - VPOC (16 Feb) 60297 - B TPO h/b (16 Feb) 60154 - Buy Tail (16 Feb) 60007 - Buy tail mid (16 Feb) |
WhatsApp me (Uttam Goel) on +91 90362 79747 if you need more information

Markets don't move because indicators change.
Indicators change because markets move.
A practical reference for NSE & BSE derivatives traders. 366 pages, built to sit open beside live charts.