
Love Vtrender Charts? Check out our new offer!
Nifty May F: 24425 [ 24567 / 24396 ]
Open Type |
|---|
OAOR (Open Auction) |
Volumes of 11,275 contracts |
Below Average
Initial Balance |
|---|
24567 - 24416 (152 points) |
Volumes of 33,814 contracts |
Below Average
Day Type |
|---|
24567 - 24396 (172 points) Normal ('b' shape) |
Volumes of 79,024 contracts |
Below Average
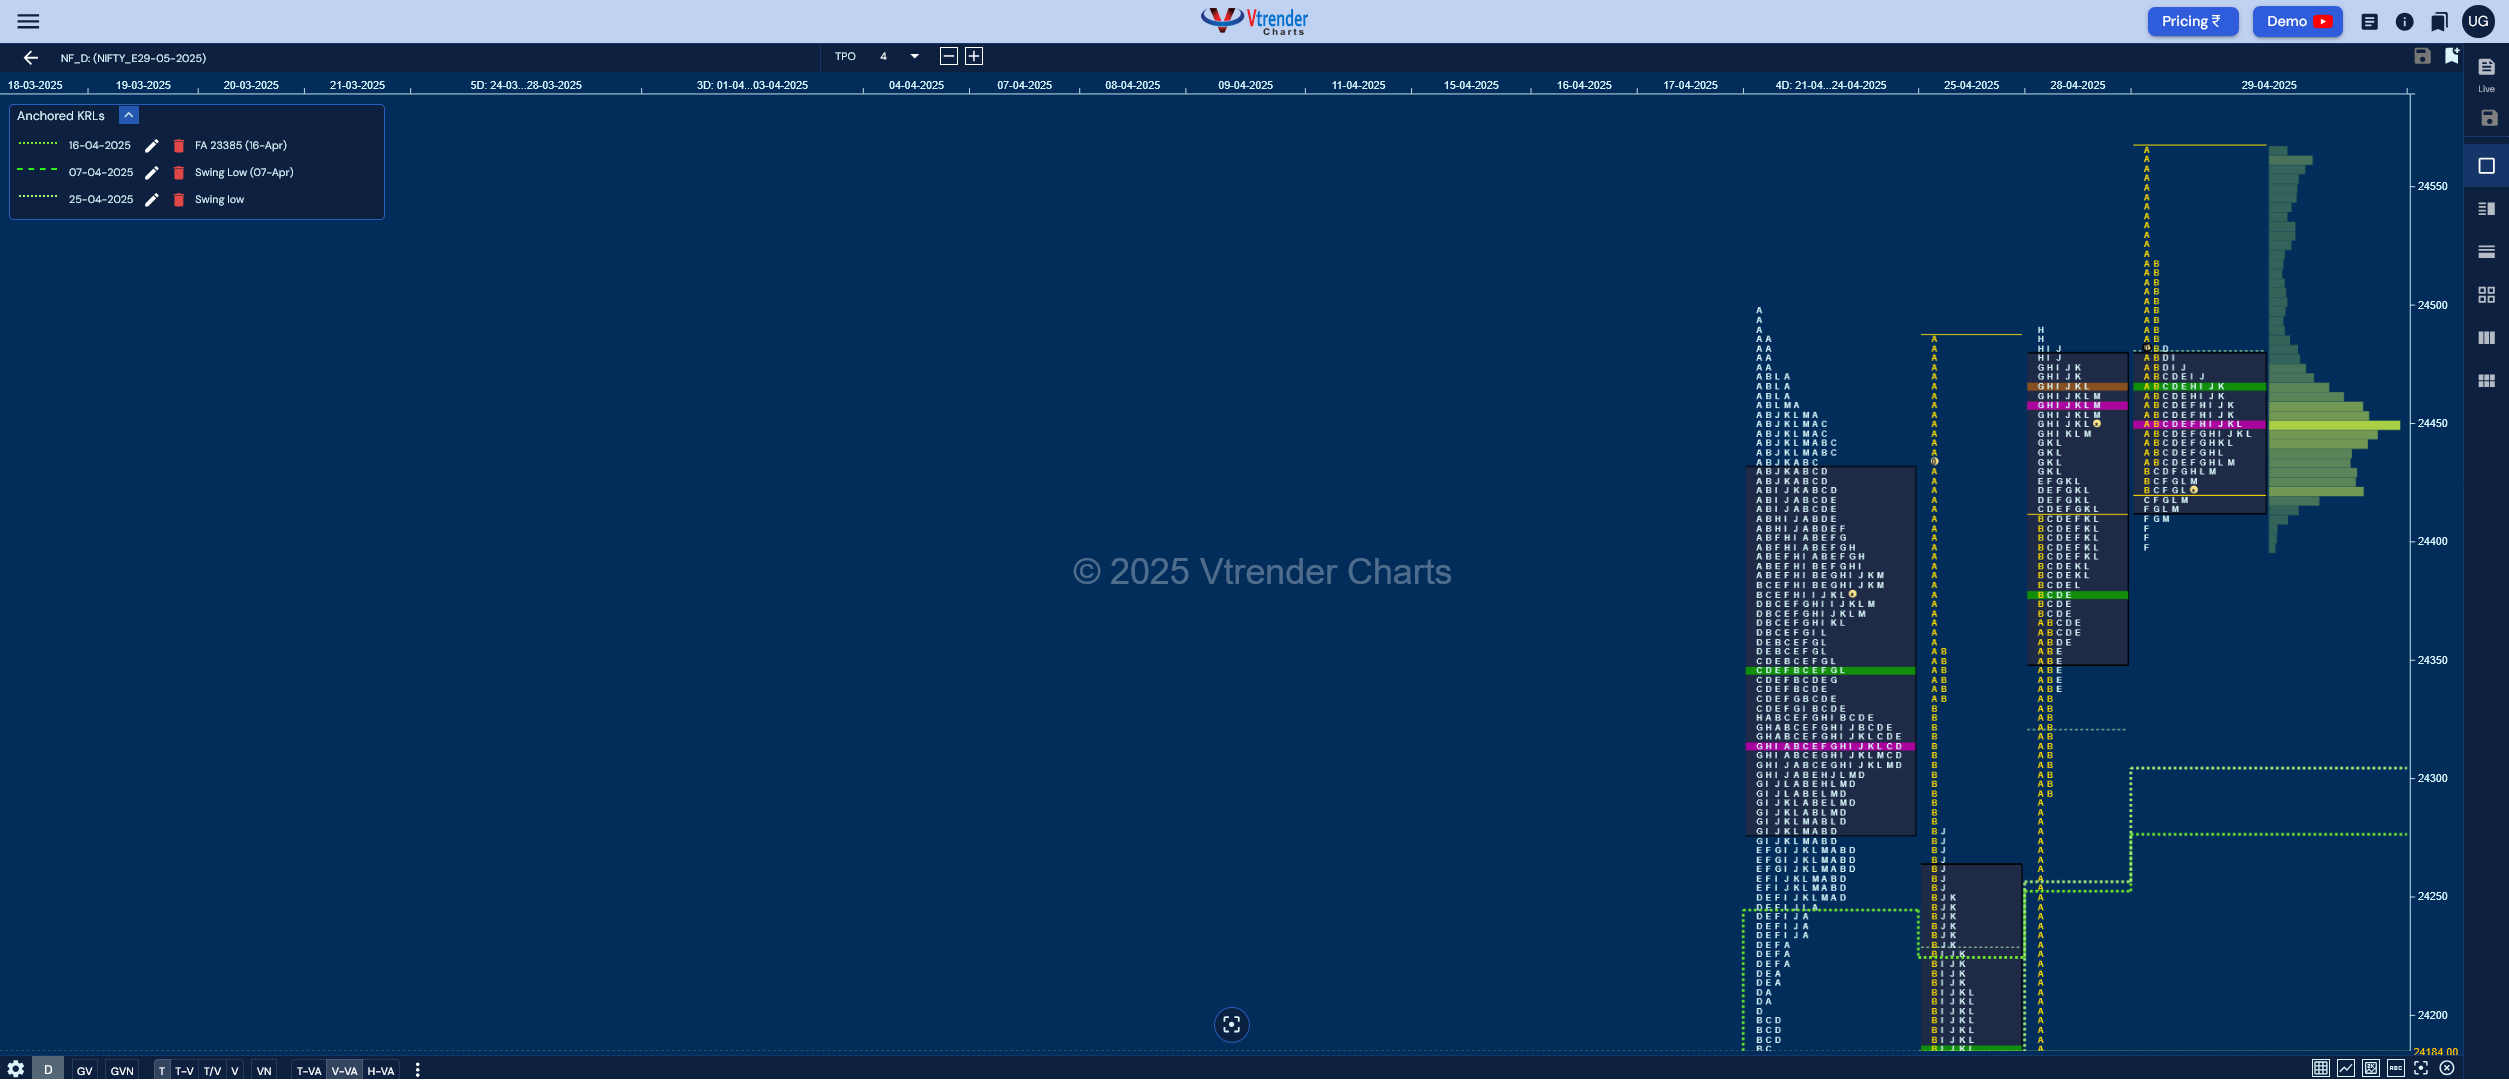
NF opened higher but failed to get fresh demand leaving an initiative selling tail in the IB (Initial Balance) after which it settled down into a narrow range taking support just above 28th Apr's VWAP of 24378 which coincides with the May Series's RO (Roll Over) point as well leaving a long liquidation 'b' shape profile for the day.
The auction has formed overlapping Value with a 'p' shape followed by a 'b' thus shaping up a 3-1-3 composite over the last 2 days and has a good chance of moving away from this value provided it gets initiative volumes in the coming session(s).
Click here to view the latest profile in NF on Vtrender Charts
Largest volume (POC) was traded at 24450 F and VWAP of the session was at 24466
Value zones (volume profile) are at 24416-24450-24482
HVNs are at NA** (** denotes series POC)
Weekly Charts can be viewed here
(21-24 Apr) - NF has formed a composite 'p' shape profile on the weekly with completely higher Value at 24279-24315-24289 with a buying tail from 24090 to 23980 which will be the support zone as the new series develops
The settlement day Roll Over point (May 2025) is 24378
The VWAP & POC of Apr 2025 Series is 23389 & 24179 respectively
The VWAP & POC of Mar 2025 Series is 22991 & 22491 respectively
The VWAP & POC of Feb 2025 Series is 22982 & 22900 respectively
(These are the actionable levels to watch out where we can initiate fresh trades based on getting further confirmation from the OrderFlow)
Up |
|---|
24434 - M TPO high (29 Apr) 24482 - VAH (29 Apr) 24520 - A TPO VWAP (29 Apr) 24567 - PDH 24616 - 1 ATR (24321) 24673 - 1 ATR (24378) |
Down |
|---|
24416 - VAL (29 Apr) 24378 - VWAP (28 Apr) 24321 - 28 Apr Halfback 24277 - AVWAP (16 Apr) 24218 - IB Tail mid (28 Apr) 24179 - Apr POC |
BankNifty Apr F: 55509 [ 56194 / 55437 ]
Open Type |
|---|
OA (Open Auction) |
Volumes of 12,047 contracts |
Above Average |
Initial Balance |
|---|
56194 - 55701 (494 points) |
Volumes of 25,247 contracts |
Below Average |
Day Type |
|---|
56194 - 55437 (715 points) Normal Variation |
Volumes of 54,521 contracts |
Average |
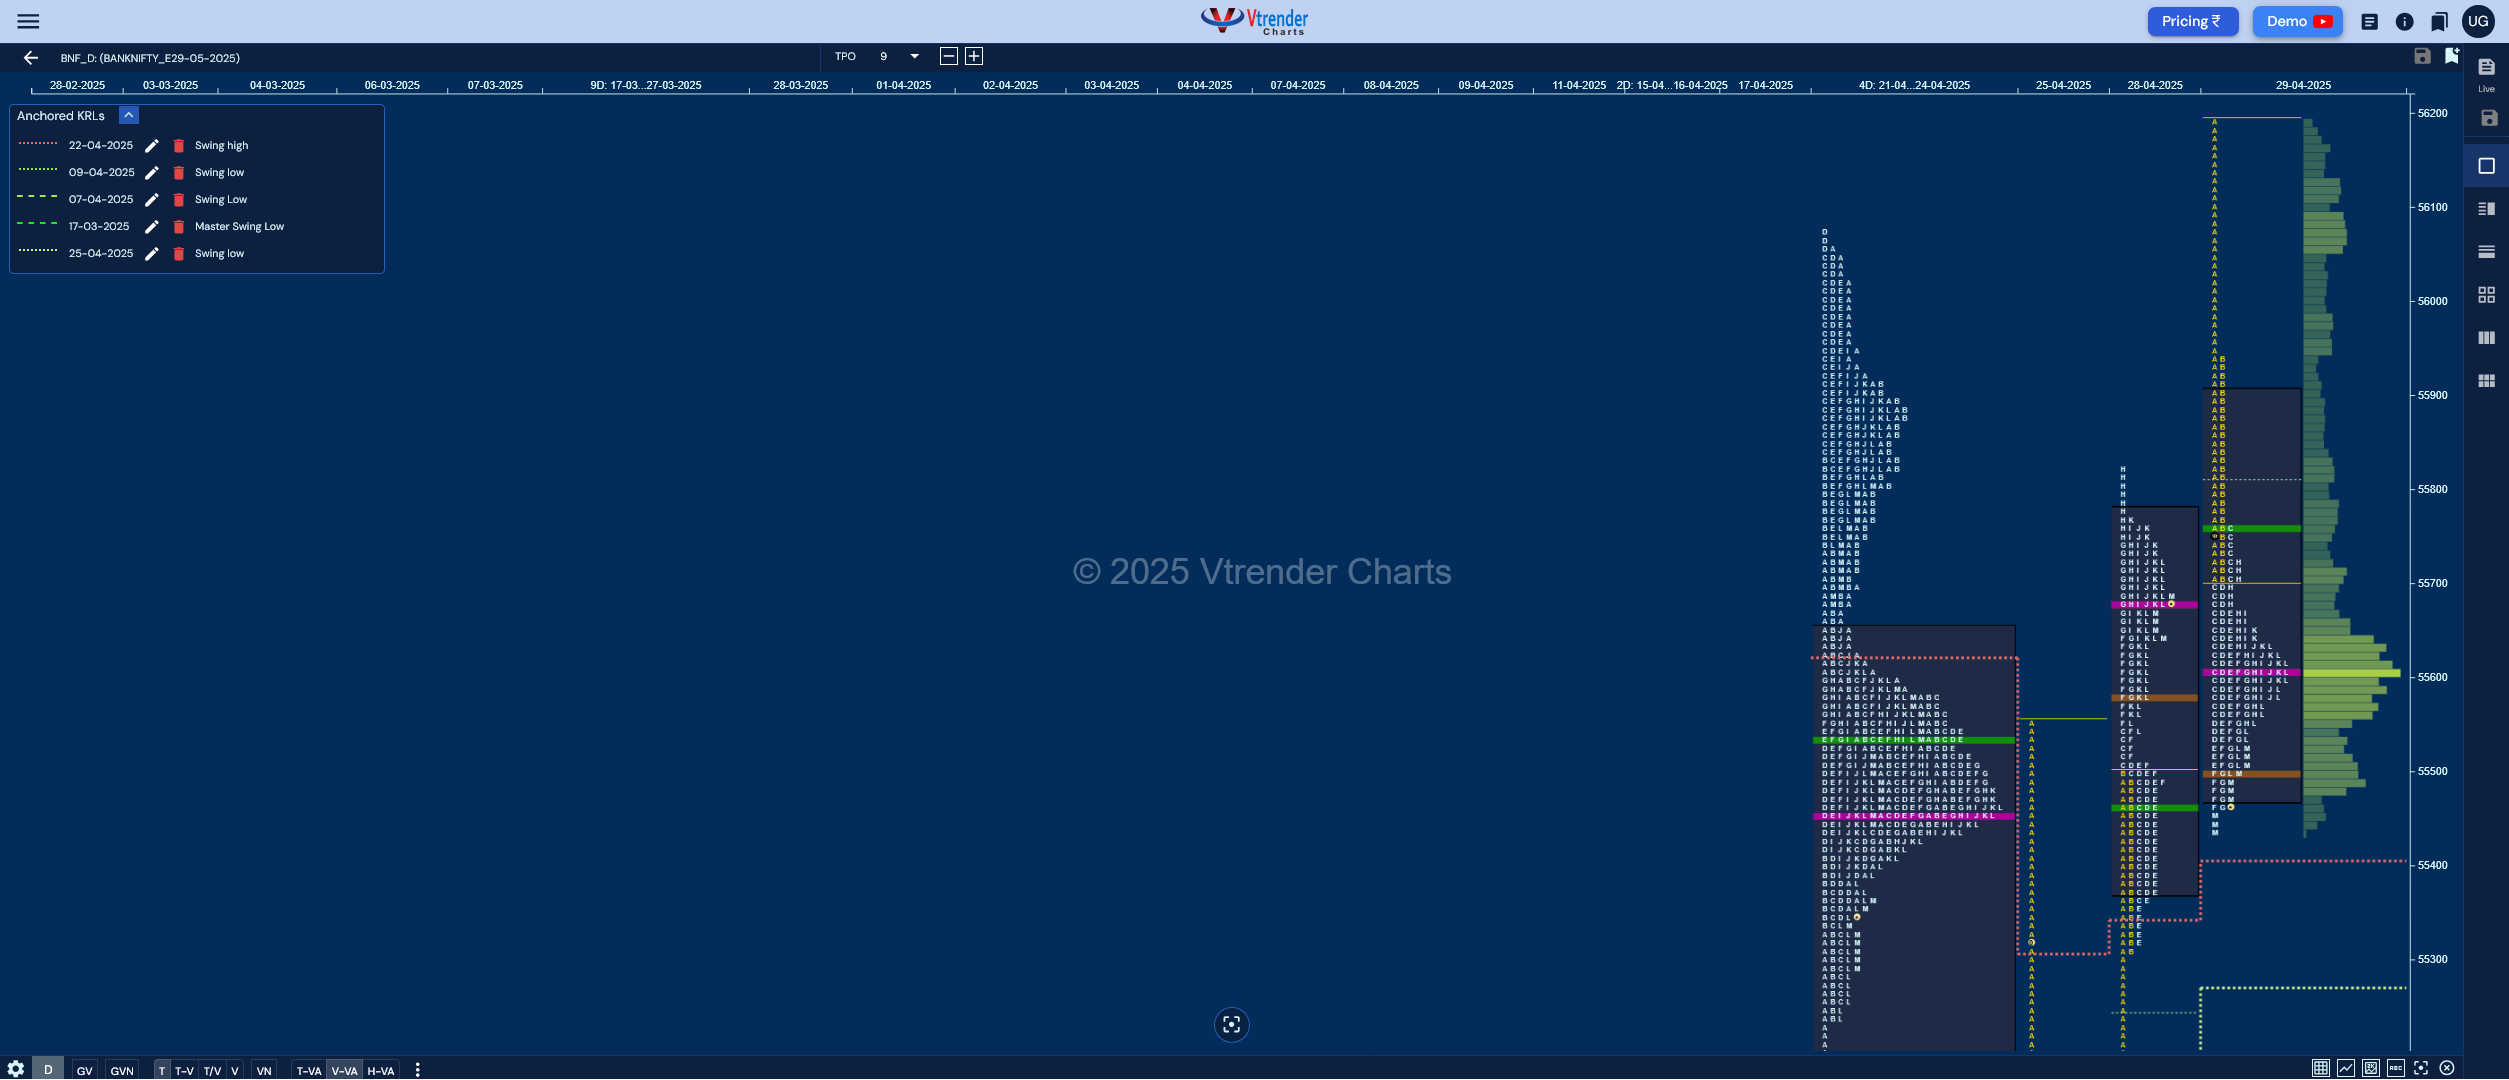
BNF also opened higher hititng new highs for the new series of May but saw some supply coming in as it left a long A period selling tail and got back into previous range and value making couple of REs (Range Extension) lower testing 28th Apr's VWAP of 55467 where it took support and closed as a 'b' shape profile.
Value for the day was overlapping to higher but the special case A period singles could mean initiative sellers have taken an entry so as long as that holds we can expect more downside to come in the coming session(s).
Click here to view the latest profile in BNF on Vtrender Charts
Largest volume (POC) was traded at 55610 F and VWAP of the session was at 55758
Value zones (volume profile) are at 55468-55610-55907
HVNs are at NA** (** denotes series POC)
Weekly Charts can be viewed here
The settlement day Roll Over point (May 2025) is 55348
The VWAP & POC of Apr 2025 Series is 52751 & 55353 respectively
The VWAP & POC of Mar 2025 Series is 49563 & 48335 respectively
The VWAP & POC of Feb 2025 Series is 49361 & 49290 respectively
(These are the actionable levels to watch out where we can initiate fresh trades based on getting further confirmation from the OrderFlow)
Up |
|---|
to be updated... |
Down |
|---|
to be updated... |
You can check the monthly charts & other swing levels for both Nifty & BankNifty here & for the weekly charts & analysis, please click here.

Markets don't move because indicators change.
Indicators change because markets move.
A practical reference for NSE & BSE derivatives traders. 366 pages, built to sit open beside live charts.