01 — LOCATION
Mark the structure
Start with Market Profile. Identify value, DPOC, VAH, VAL, prior levels, and the current auction state. Is price inside or outside value? Balancing or trending?
Free MarketProfile charts - Check out Vtrender Charts
Market Profile. Order Flow. Gamma Density. Gamma Exposure. NTM VolX. Spectrum. MFLOW. Options Overlay. Smart Candlesticks. Nine reading layers — one platform — for NSE and BSE derivatives traders.
Start with price. Then see value, intent, options positioning, volatility pressure, and whether the participation is fresh or unwind.
Used by NSE and BSE derivatives traders since 2010. Free plan available — no credit card.
Each tool on Vtrender Charts answers a question your price chart cannot. Together they form a complete picture of structure, intent, and options pressure.
Free plan includes live Market Profile for NIFTY, BANKNIFTY, Sensex and Bankex. No credit card required.
The Vtrender method reads the market in sequence — not as simultaneous noise. Each step builds on the one before it.
Start with Market Profile. Identify value, DPOC, VAH, VAL, prior levels, and the current auction state. Is price inside or outside value? Balancing or trending?
Use Gamma, Spectrum, and NTM VolX to see where options pressure is building. Gamma Walls, Gamma Zero, and VXR tell you what the options market is doing to the underlying.
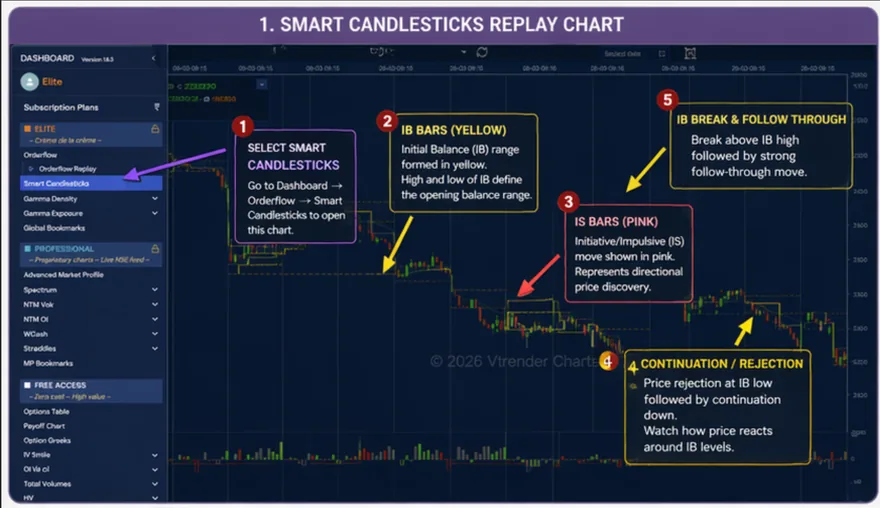
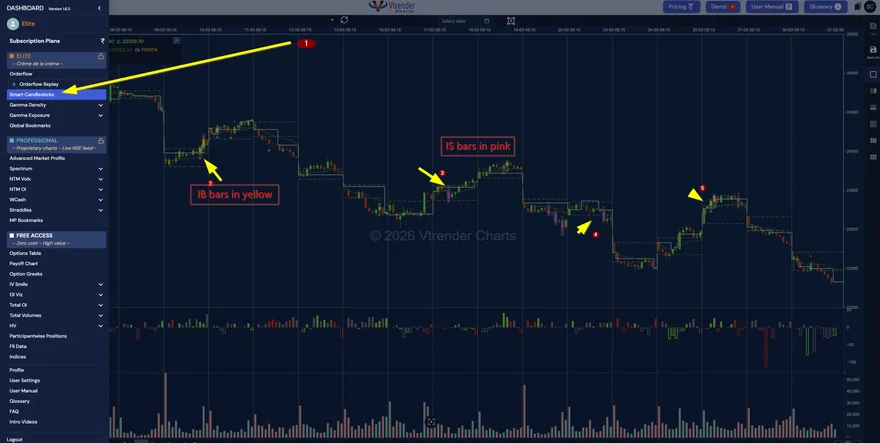
Use Order Flow, IB/IS, COT, and MFLOW to see who is acting, whether the aggression is real, and whether the move is new business or simply covering.
Session replay, the workbook, e-course modules, and Live Desk sessions build the recognition that turns reading into a process rather than a reaction.
Each Vtrender tool is built around a specific question. Knowing which question each tool answers is how the workflow becomes a reading discipline.
Read initiative buyers, initiative sellers, COT, and volume pressure at price. Delta tells you direction. COT tells you whether the aggressor won.
Read DPOC, value boundaries, balance and imbalance, single prints, and unfinished business from prior sessions.
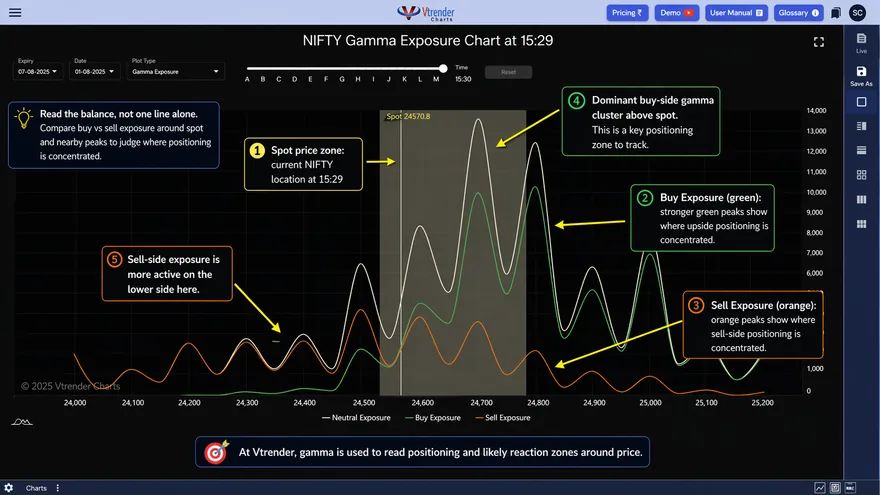
Read Gamma Density and Exposure alongside the live auction. Positive GEX dampens moves. Negative GEX amplifies them.
Separate new positions from covering and rolls. A covering rally and a conviction rally look identical on price — MFLOW shows the difference.
Vtrender Charts gives you the tools. These two resources give you the framework to use them well — built specifically around how Market Profile, Order Flow, and options flow work on NSE.
The structured learning path for traders who want to build a complete reading process from the
ground up. Covers auction market theory, Market Profile day types, Order Flow reading, options
context, and how to combine each layer into a session-by-session workflow.
Built around Vtrender Charts. Learn what each tool is showing you and exactly why it matters.
366 pages. 60,000 words. The complete written companion for traders learning to read Order Flow on
NSE — delta, COT, absorption, initiative buying and selling, MFLOW, and how each concept applies to
NIFTY and BANKNIFTY sessions.
DRM-free PDF. Read it alongside your charts. Mark it up. It is the field manual for traders who want
the language and the process, not just the indicators.
Open the charts first. Then use these resources to understand what you are reading.
The central hub linking all nine Vtrender tools, study routes, YouTube playlists, the book, and E-Course.
Start the pathway →The complete pillar guide to auction market theory, value areas, day types, and how to read structure on NSE.
Read the guide →Delta, COT, IB/IS, footprint, and how to read the aggression layer beneath price — with NSE-specific context throughout.
Read the guide →Watch structure develop during the session. See how evidence is ordered in real time by a trader who has used these tools since 2010.
Join the desk →IB, IS, COT, DPOC, VAH, VAL, Gamma, NTM VolX, MFLOW — every term defined clearly and in context.
Open glossary →Written by the Vtrender Research Desk. No tips. No predictions. How the reading actually works on NIFTY and BANKNIFTY.
Quick answers on what the platform is, what the free plan includes, and how the reading layers work.
Vtrender Charts is a real-time analytics platform for NSE and BSE derivatives traders. It provides Market Profile TPO charts, Order Flow Replay, Gamma Density and GEX, NTM VolX, Spectrum, MFLOW, Smart Candlesticks, and Options Overlay — nine reading layers on one platform.
Yes. The Vtrender Charts free plan includes live Market Profile charts for NIFTY, BANKNIFTY, Sensex and Bankex. No credit card is required.
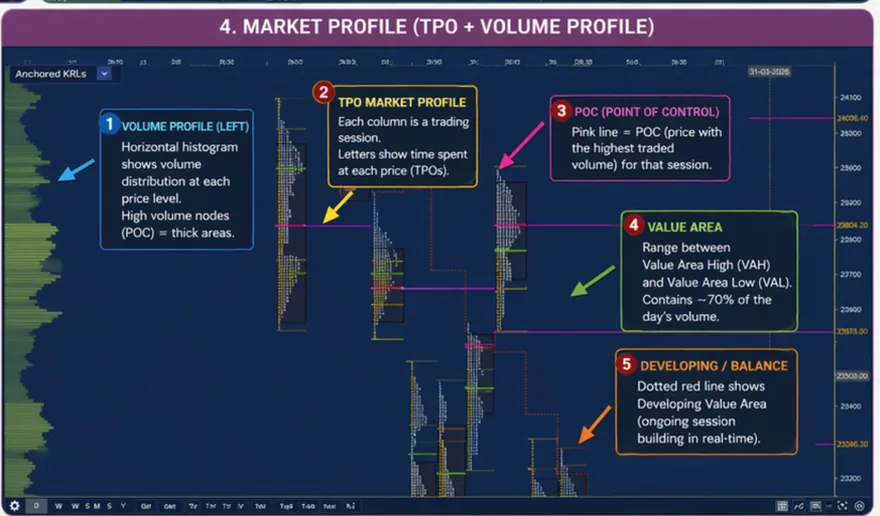
Market Profile is a charting method that shows the time a market spends at each price level, revealing Value Area, Point of Control, and session structure. Vtrender Charts uses TPO-based Market Profile combined with Volume Profile to show where the NSE auction accepted or rejected price.
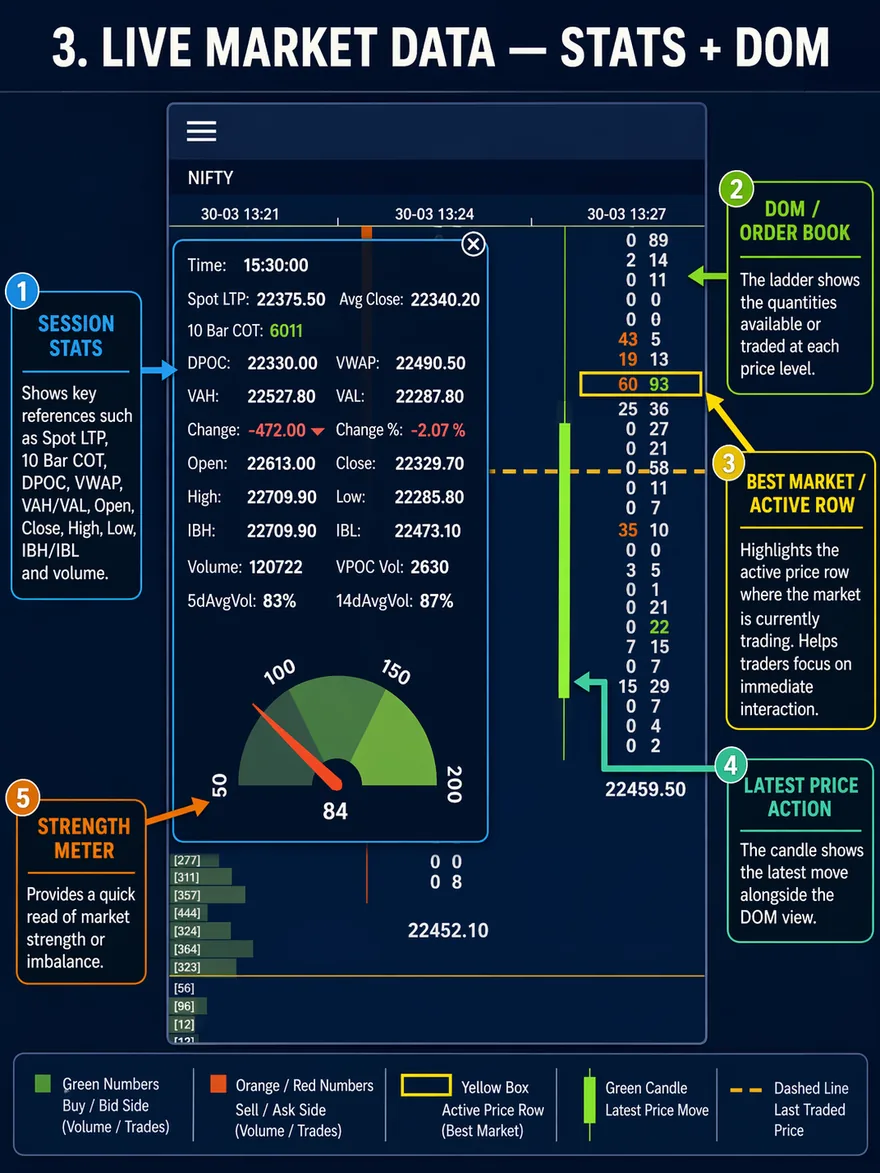
Unlike OHLC, which only shows Open, High, Low and Close of each bar, Order Flow data goes deeper into the ticks received on the exchange and shows you demand and supply in the market. You see what happened between the Open and Close of the bar, and at the highs and lows of the same bar. This data is used extensively by institutions.
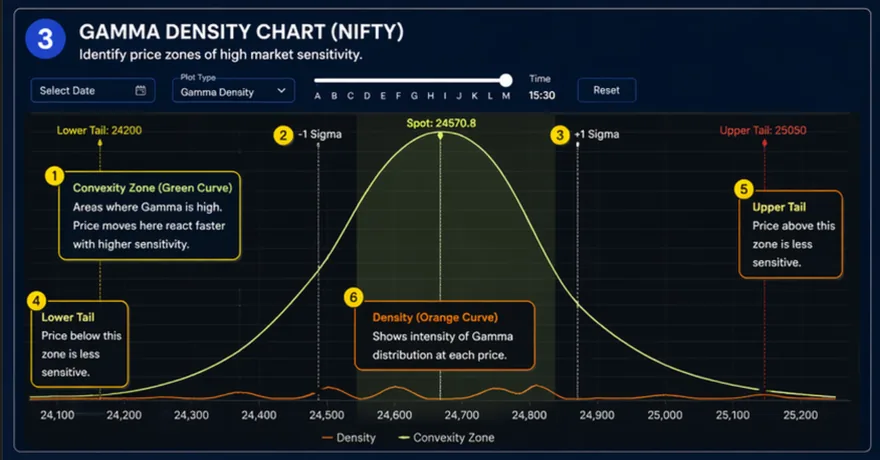
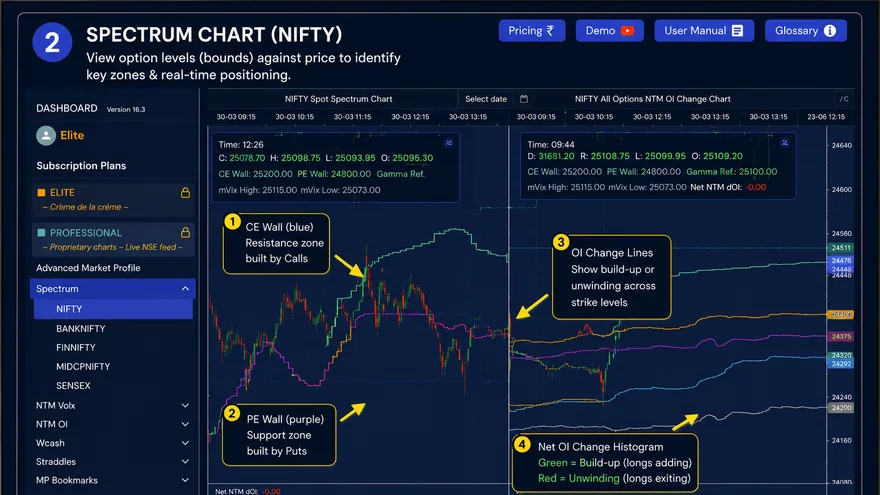
A standard options chain shows open interest and volume by strike. Vtrender Charts adds Gamma Density, Gamma Exposure (GEX), Spectrum, and NTM VolX — which show how options writer positioning creates mechanical pressure on the underlying price, not just what positions exist.
The Vtrender Learning Pathway takes you from auction basics through to reading a live NIFTY session with Market Profile, Order Flow, and options tools — step by step, in the sequence that actually builds pattern recognition.
Observe. Do not predict.